
In this blog post, we will share our analysis on Ambuja Cement Share Price Target for 2024, 2025 to 2030 based on market trends, historical performances, balance sheet analysis, profit & loss report analysis . To know how the stock will perform and how hight it’s share price expected to go in the upcoming years based on our analysis, read this complete analysis.
What is Ambuja Cement Ltd.?
Ambuja Cements Limited, headquartered in India, specializes in the production and distribution of cement and associated products. Its core activities revolve around manufacturing and selling various types of cement, including Ambuja Cement, Ambuja Kawach, Ambuja Plus, and more.
Additionally, the company offers comprehensive support services to a range of stakeholders such as individual home builders, masons, contractors, architects, and engineers.
Through its subsidiary ACC Ltd., Ambuja Cements Limited boasts a combined capacity exceeding 67.5 million tons. This capacity is spread across fourteen integrated cement manufacturing plants and sixteen cement grinding units strategically located throughout the country.
Among its diverse subsidiaries are entities like M.G.T Cements Private Limited, Chemical Limes Mundwa Private Limited, Dirk India Private Limited, and others, contributing to its extensive portfolio and market presence.
Company Profile
| Former Name | Gujarat Ambuja Cements Limited (1983–2007) |
| Company Type | Public |
| Traded as | BSE: 500425 NSE: AMBUJACEM |
| Industry | Building materials |
| Founded | 1983 (41 years ago) |
| Headquarters | Mumbai, Maharashtra, India |
| Key People | Gautam Adani (Chairman) Suresh Kumar Neotia (Founder) Narotam Sekhsaria (Co-Founder and Chairman Emeritus) Ajay Kapur (Whole-time Director & CEO) |
| Products | Cement |
| Revenue | ₹39,674.7 crore (US$5.0 billion) (2023) |
| Net Income | ₹2,583.4 crore (US$320 million) (2023) |
| Total Assets | ₹51,721.5 crore (US$6.5 billion) (2023) |
| Total Equity | ₹31,698.2 crore (US$4.0 billion) (2023) |
| Owner | Adani Group (63.2%) |
| Parent | Adani Group |
| Website | www.ambujacement.com |
Ambuja Cement Ltd. Fundamental Analysis
| Market Cap | ₹ 1,37,838.24 Cr. |
| Enterprise Value | ₹ 1,35,352.90 Cr. |
| No. of Shares | 219.77 Cr. |
| P/E | 59.81 |
| P/B | 4.09 |
| Face Value | ₹ 2 |
| Div. Yield | 0.4% |
| Book Value (TTM) | ₹ 153.32 |
| Cash | ₹ 2,533.05 Cr. |
| Debt | ₹ 47.71 Cr. |
| Promoter Holding | 63.19% |
| EPS (TTM) | ₹ 10.49 |
| Sales Growth | 42.97% |
| ROE | 11.17% |
| ROCE | 12.53% |
| Profit Growth | 22.58% |
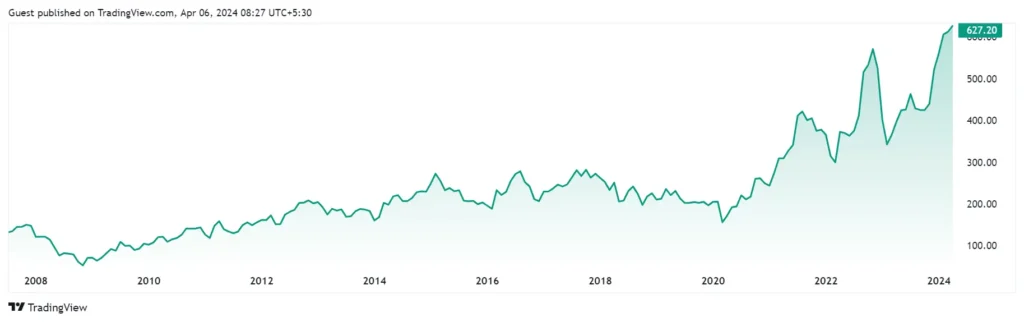
Ambuja Cement Ltd. Share Price Historical Chart
Ambuja Cement Share Price Target 2024, 2025 to 2030
Ambuja Cement Share Price Target 2024
| Year | AMBUJACEM Share Price Target 2024 |
|---|---|
| 2024 | ₹810 |
Adani Group has boosted its stake in Ambuja Cements, the flagship company in the Adani portfolio, with an infusion of Rs 6,661 crore. This additional investment increases Adani Group’s holding to 66.7%, reflecting a strong commitment to bolstering the cement vertical’s future prospects.
The move aims to strengthen Ambuja Cements’ financial position, enabling it to pursue ambitious growth plans and seize emerging market opportunities. Ajay Kapur, Ambuja Cements Ltd.’s Whole Time Director and CEO, expressed enthusiasm about the increased stake, emphasizing its significance in providing capital flexibility for accelerated growth and reinforcing the company’s commitment to long-term sustainable value creation.
Despite potential volatility due to elections, Avinash Gorakshakar of ProfitMart Securities and ET NOW Swadesh anticipates a 10-12% rally in Ambuja Cements stock price over the next 3-4 months.
As per our projections, ambuja cement share price potentially reach ₹810 at the end of 2024.
Also Read: Astra Micro Share Price Target 2024, 2025 to 2030
Ambuja Cement Share Price Target 2025
| Year | AMBUJACEM Share Price Target 2025 |
|---|---|
| 2025 | ₹1090 |
Our Experts predicts an initial target of ₹810 in January 2025, potentially reaching ₹1090 by December 2025 under favorable conditions.
Also Read: Mahan Industries Share Price Target 2024, 2025 to 2030
Ambuja Cement Share Price Target 2030
| Year | AMBUJACEM Share Price Target 2030 |
|---|---|
| 2030 | ₹2800 – ₹3200 |
Our Experts predict a bullish target, reaching ₹2800 – ₹3200 by 2030
Also Read: RVNL Share Price Target 2024, 2025, 2030, 2040, 2050: A Strategic Analysis
Ambuja Cement Ltd. Share Balance Sheet Analysis
| Balance Sheet Data | DEC 2020 | DEC 2021 | MAR 2023 |
|---|---|---|---|
| Equity and Liabilities | |||
| Share Capital | 397.13 | 397.13 | 397.13 |
| Total Reserves | 19,918.73 | 21,807.80 | 28,108.41 |
| Borrowings | 43.60 | 43.50 | 34.22 |
| Other Non-Current Liabilities | 578.39 | 577.69 | 940.90 |
| Current Liabilities | 4,543.53 | 5,356.67 | 6,423.47 |
| Total Liabilities | 25,481.38 | 28,182.79 | 35,904.13 |
| Assets | |||
| Net Block | 5,931.50 | 7,670.83 | 8,619.75 |
| Capital Work in Progress (WIP) | 1,873.74 | 951.35 | 841.87 |
| Intangible WIP | 0 | 0 | 0 |
| Investments | 11,792.21 | 11,773.88 | 11,775.88 |
| Loans & Advances | 668.39 | 486.98 | 490.30 |
| Other Non-Current Assets | 784.73 | 519.27 | 2,929.82 |
| Current Assets | 4,430.81 | 6,780.48 | 11,246.51 |
| Total Assets | 25,481.38 | 28,182.79 | 35,904.13 |
Analysis:
- Equity and Liabilities:
- Equity (Share Capital + Reserves): Equity has grown significantly from DEC 2020 to MAR 2023, indicating strong internal capital generation.
- Borrowings: Ambuja maintains a very low debt profile, with borrowings consistently below ₹50 Crore.
- Current Liabilities: Current liabilities have increased steadily, possibly due to higher business activity or inventory levels.
- Assets:
- Net Block: Increase in net block suggests ongoing investments in property, plant, and equipment, which could indicate future capacity expansion.
- Investments: Relatively stable levels of investments suggest a cautious approach to capital allocation.
- Current Assets: Significant increase in current assets, particularly in MAR 2023, needs further investigation. It could be due to higher inventory levels, receivables, or cash.
Ambuja Cement Ltd. Share Loss & Profit Report
| DATA | DEC 2020 | DEC 2021 | MAR 2023 |
|---|---|---|---|
| Net Sales | 11,371.86 | 13,979.04 | 19,985.43 |
| Total Expenditure | 8,725.26 | 10,763.89 | 16,764.99 |
| Operating Profit | 2,646.60 | 3,215.15 | 3,220.44 |
| Other Income | 372.28 | 81.18 | 952.27 |
| Interest | 83.05 | 91.12 | 127.97 |
| Depreciation | 521.17 | 551.74 | 832.42 |
| Exceptional Items | -65.69 | -157.27 | – |
| Profit Before Tax | 2,414.38 | 2,787.90 | 3,055.05 |
| Tax | 624.28 | 704.71 | 501.56 |
| Net Profit | 1,790.10 | 2,083.19 | 2,553.49 |
| Adjusted EPS (Rs.) | 9.02 | 10.49 | 12.86 |
Analysis:
- Revenue: Revenue has grown steadily over the last 3 years, indicating healthy sales growth.
- Expenditure: Total expenditure has also increased, but at a slower pace compared to revenue growth.
- Operating Profit: Operating profit has grown consistently, reflecting a healthy core business performance.
- Profitability: Net profit has also shown a steady upward trend, indicating increasing profitability.
- Margins: We cannot calculate specific margins (profitability ratios) without data on Cost of Goods Sold (COGS) or Selling, General & Administrative (SG&A) expenses.
Ambuja Cement Ltd. Share Quick Anlaysis Report: Buy Or Sell?
PE ratio: The Price to Earnings ratio indicates how much investors are willing to pay for a share relative to its earnings. Ambuja Cement’s PE ratio of 59.81 suggests it may be overvalued.
Share Price: Ambuja Cement’s current share price is Rs 627.20, which can be assessed using valuation calculators to determine if it’s undervalued or overvalued.
Return on Assets (ROA): ROA measures how effectively a company can generate profits from its assets. Ambuja Cement’s ROA of 7.97% may signal potential challenges for future performance.
Current ratio: This measures a company’s ability to pay its short-term liabilities with its short-term assets. Ambuja Cement’s current ratio of 1.75 indicates stability but could be improved.
Return on equity (ROE): ROE gauges a company’s ability to generate profits from shareholder investments. Ambuja Cement’s ROE of 11.17% is moderate.
Debt to equity ratio: This metric assesses a company’s capital structure and performance. Ambuja Cement’s D/E ratio of 0.00 indicates a low proportion of debt.
Inventory turnover ratio: This evaluates a company’s inventory management efficiency. Ambuja Cement’s ratio of 14.39 suggests room for improvement in inventory and working capital management.
Sales growth: Ambuja Cement has reported revenue growth of 42.97%, indicating fair performance.
Operating Margin: This indicates operational efficiency. Ambuja Cement’s operating margin for the current financial year is 16.11%.
Dividend Yield: This tells investors how much dividend they will receive relative to the stock price. Ambuja Cement’s current year dividend yield is 0.40%, with a dividend of Rs 2.50.
👍 Strengths
- Over the past 3 years, the company has demonstrated robust profit growth of 18.65%.
- The company has achieved impressive revenue growth of 19.65% over the same period.
- Maintaining a virtually debt-free status enhances the company’s financial stability.
- With a healthy interest coverage ratio of 24.87, the company exhibits strong capability to meet its interest obligations.
- Efficient cash conversion cycle of -148.80 days indicates effective management of working capital.
- Strong cash flow management is evident with a CFO/PAT ratio of 1.07.
- A high promoter holding of 63.19% underscores confidence in the company’s performance.
👎 Weakness
- Despite its strengths, the company is currently trading at a relatively high EV/EBITDA ratio of 32.13.
Conclusion
In conclusion, while Ambuja Cement has strengths such as revenue growth and low debt, it also has limitations like a high PE ratio and room for improvement in inventory management. Investors should conduct further research and consider their investment goals before deciding if Ambuja Cement is an attractive stock to invest in.
FAQs
Disclaimer: Dear Readers, Please note, These stock price projections are based on various factors like past performance, fundamentals, technical signals and market trends. These projections are for informational purposes only and aren’t financial advice or guarantees.