
Today, we explore RIL Share Price Target for 2024, 2025, 2030 and so on. To know how the stock will perform in the upcoming years, read the complete technical and fundamental analysis report.
What is RIL (Reliance Industries Ltd.)?
Reliance Industries Limited, headquartered in Mumbai, is an Indian multinational conglomerate with diverse interests spanning energy, petrochemicals, natural gas, retail, telecommunications, mass media, entertainment, and textiles. It holds the distinction of being the largest public company in India by both market capitalization and revenue, and ranks among the top 100 companies globally.
In 2023, it secured the 45th position in the Forbes Global 2000 list. Notably, Reliance is India’s leading private taxpayer and exporter, contributing significantly to the nation’s economy.
However, the company has faced scrutiny and criticism for various issues including alleged political corruption, cronyism, fraud, financial irregularities, and concerns regarding its impact on consumers, citizens, and natural resources. Mukesh Ambani, the chairman of Reliance Industries, has often been labeled as a plutocrat.
Company Profile
| Former Names | Reliance Commercial Corporation (1958–1966) Reliance Textiles and Engineers (1966–1973) |
| Company Type | Public |
| Traded as | BSE: 500325, NSE: RELIANCE LSE: RIGD |
| ISIN | INE002A01018 |
| Industry | Conglomerate |
| Founded | 1958 (66 years ago) |
| Founder | Dhirubhai Ambani |
| Headquarters | Mumbai, Maharashtra, India |
| Area Served | Worldwide |
| Key People | Mukesh Ambani (Chairman & Managing Director) |
| Products | Petroleum, Natural gas, Chemicals, Petrochemicals, Oil refining, Retail, Telecommunications, Media, Entertainment |
| Revenue (2023) | ₹974,864 crore (US$120 billion) |
| Operating Income (2023) | ₹94,801 crore (US$12 billion) |
| Net Income (2023) | ₹73,670 crore (US$9.2 billion) |
| Total Assets (2023) | ₹1,713,506 crore (US$210 billion) |
| Total Equity (2023) | ₹821,153 crore (US$100 billion) |
| Owner | Mukesh Ambani (50.39%) |
| Number of Employees (2023) | 389,414 |
| Subsidiaries | Jio Platforms, Reliance Retail, Jio-bp, Network18 Group, DEN Networks, Hathway, Alok Industries, Reliance Foundation, Indiawin Sports, Relicord, Reliance Institute of Life Sciences, Reliance Industrial Infrastructure, Renewable Energy Corporation |
| Website | www.ril.com |
Reliance Industries Ltd. Fundamental Analysis
| Market Cap | ₹ 19,28,848.53 Cr. |
| Enterprise Value | ₹ 20,87,860.53 Cr. |
| Number of Shares | 676.61 Cr. |
| P/E | 43.17 |
| P/B | 3.83 |
| Face Value | ₹ 10 |
| Div. Yield | 0.32 % |
| Book Value (TTM) | ₹ 743.70 |
| Cash | ₹ 56,811 Cr. |
| Debt | ₹ 2,15,823 Cr. |
| Promoter Holding | 50.3 % |
| EPS (TTM) | ₹ 66.03 |
| Sales Growth | 25.10% |
| ROE | 9.05 % |
| ROCE | 9.81% |
| Profit Growth | 13.39 % |
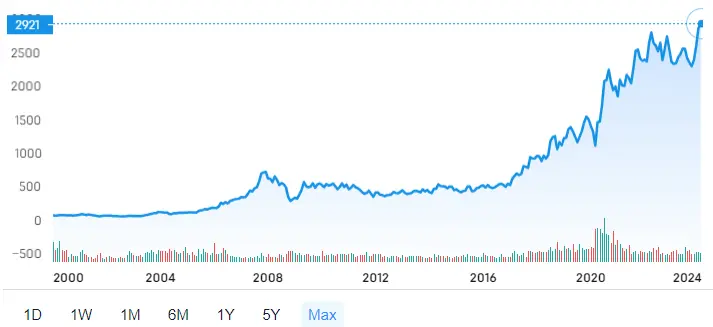
Reliance Industries Ltd. Share Price Growth Chart
Reliance Industries Ltd. Profit & Loss Analysis
| DATA | MAR 2019 | MAR 2020 | MAR 2021 | MAR 2022 | MAR 2023 |
|---|---|---|---|---|---|
| Net Sales | 3,71,616 | 3,36,953 | 2,45,667 | 4,22,323 | 5,28,315 |
| Total Expenditure | 3,12,762 | 2,84,295 | 2,13,375 | 3,71,383 | 4,63,856 |
| Operating Profit | 58,854 | 52,658 | 32,292 | 50,940 | 64,459 |
| Other Income | 8,822 | 13,736 | 16,026 | 13,843 | 12,418 |
| Interest | 9,751 | 12,105 | 16,211 | 9,123 | 12,626 |
| Depreciation | 10,558 | 9,728 | 9,199 | 10,264 | 10,118 |
| Exceptional Items | 0 | -4,245 | 4,304 | 0 | 0 |
| Profit Before Tax | 47,367 | 40,316 | 27,212 | 45,396 | 54,133 |
| Tax | 12,204 | 9,413 | -4,732 | 7,459 | 11,116 |
| Net Profit | 35,163 | 30,903 | 31,944 | 39,084 | 44,205 |
| Adjusted EPS (Rs.) | 54.95 | 48.29 | 49.56 | 56.08 | 63.58 |
- Net Sales: RIL’s net sales have increased steadily over the past five years, from ₹ 3,71,616 Cr in March 2019 to ₹ 5,28,315 Cr in March 2023. This indicates a growth in revenue from the company’s core operations.
- Total Expenditure: Total expenditure has also increased over the same period, but at a slower pace than net sales. This has resulted in an improvement in operating profit.
- Operating Profit: Operating profit has increased from ₹ 58,854 Cr in March 2019 to ₹ 64,459 Cr in March 2023. This indicates that RIL is becoming more efficient in managing its operating costs.
- Other Income: Other income has fluctuated over the past five years, but it has generally been positive.
- Interest: Interest expense has increased over the past five years, likely due to the company’s increasing debt levels.
- Profit Before Tax: Profit before tax has increased from ₹ 47,367 Cr in March 2019 to ₹ 54,133 Cr in March 2023. This indicates that RIL’s profitability has improved over the past five years.
- Net Profit: Net profit has also increased over the past five years, from ₹ 35,163 Cr in March 2019 to ₹ 44,205 Cr in March 2023. This reflects an improvement in RIL’s overall profitability.
- Adjusted EPS (Rs.): Adjusted earnings per share (EPS) has increased from ₹ 54.95 in March 2019 to ₹ 63.58 in March 2023. This indicates that RIL’s profitability has grown at a faster pace than its number of outstanding shares.
Reliance Industries Ltd. Balance Sheet Analysis
| DATA | MAR 2019 | MAR 2020 | MAR 2021 | MAR 2022 | MAR 2023 |
|---|---|---|---|---|---|
| Equity and Liabilities | |||||
| Share Capital | 6,339 | 6,339 | 6,445 | 6,765 | 6,766 |
| Total Reserves | 3,98,983 | 3,84,876 | 4,68,038 | 4,64,762 | 4,72,328 |
| Borrowings | 1,18,098 | 1,94,402 | 1,60,598 | 1,67,231 | 1,35,561 |
| Other N/C liabilities | 59,744 | 62,600 | 38,313 | 39,721 | 45,071 |
| Current liabilities | 2,02,021 | 3,30,682 | 2,01,787 | 2,00,982 | 2,37,276 |
| Total Liabilities | 7,85,185 | 9,78,899 | 8,75,181 | 8,79,461 | 8,97,002 |
| Assets | |||||
| Net Block | 2,03,188 | 3,06,478 | 3,06,833 | 2,39,626 | 2,45,164 |
| Capital WIP | 1,05,155 | 15,638 | 20,765 | 19,267 | 30,958 |
| Intangible WIP | 6,402 | 12,327 | 12,070 | 15,395 | 17,957 |
| Investments | 2,72,043 | 4,21,793 | 2,52,620 | 3,30,493 | 3,03,558 |
| Loans & Advances | 44,335 | 55,978 | 71,203 | 50,568 | 31,735 |
| Other N/C Assets | 1,198 | 31 | 971 | 1,714 | 1,698 |
| Current Assets | 1,52,864 | 1,66,654 | 2,10,719 | 2,22,398 | 2,65,932 |
| Total Assets | 7,85,185 | 9,78,899 | 8,75,181 | 8,79,461 | 8,97,002 |
Equity and Liabilities
- Share Capital: RIL’s share capital has remained relatively stable over the past five years, with a slight increase from ₹ 6,339 Cr in March 2019 to ₹ 6,766 Cr in March 2023.
- Total Reserves: Total reserves have increased significantly over the past five years, from ₹ 3,98,983 Cr in March 2019 to ₹ 4,72,328 Cr in March 2023. This indicates that RIL has retained a larger portion of its earnings over time.
- Borrowings: Borrowings have fluctuated over the past five years. They increased from ₹ 1,18,098 Cr in March 2019 to ₹ 1,94,402 Cr in March 2020 and then decreased to ₹ 1,35,561 Cr in March 2023. This suggests that RIL has been managing its debt levels.
- Other Non-Current Liabilities: Other non-current liabilities have shown some variation over the five years, but there is no clear trend.
- Current Liabilities: Current liabilities have increased from ₹ 2,02,021 Cr in March 2019 to ₹ 2,37,276 Cr in March 2023. This increase is likely due to RIL’s growing business operations.
- Total Liabilities: Total liabilities have increased from ₹ 7,85,185 Cr in March 2019 to ₹ 8,97,002 Cr in March 2023. This reflects the increase in both equity and liabilities on RIL’s balance sheet.
Assets
- Net Block: Net block, which represents the net value of RIL’s property, plant, and equipment, has increased from ₹ 2,03,188 Cr in March 2019 to ₹ 2,45,164 Cr in March 2023. This indicates that RIL has been investing in its property, plant, and equipment.
- Capital WIP: Capital work in progress (WIP) has fluctuated over the past five years. It increased to ₹ 20,765 Cr in March 2021 and then decreased to ₹ 30,958 Cr in March 2023.
- Intangible WIP: Intangible work in progress (WIP) has also fluctuated over the past five years, with a slight increase from ₹ 6,402 Cr in March 2019 to ₹ 17,957 Cr in March 2023.
- Investments: Investments have increased significantly from ₹ 2,72,043 Cr in March 2019 to ₹ 3,03,558 Cr in March 2023. This suggests that RIL has been deploying its resources strategically.
- Loans & Advances: Loans and advances have fluctuated over the past five years, but there is no clear trend.
- Other Non-Current Assets: Other non-current assets have also shown some variation over the five years, but there is no clear trend.
- Current Assets: Current assets have increased from ₹ 1,52,864 Cr in March 2019 to ₹ 2,65,932 Cr in March 2023. This increase is likely due to RIL’s growing business operations and improving efficiency in managing its working capital.
- Total Assets: Total assets have increased from ₹ 7,85,185 Cr in March 2019 to ₹ 8,97,002 Cr in March 2023, reflecting growth in both RIL’s equity and liabilities.
RIL Share Price Target 2024, 2025 to 2030
RIL Share Price Target 2024
| Year | Reliance Industries Share Price Targets 2024 |
|---|---|
| 2024 | ₹2590-₹3880 |
In 2023, Indian stocks like RELIANCE witnessed a remarkable bull run, setting an optimistic tone for 2024. While the market is poised for continued bullish sentiment in the first quarter of 2024, some initial consolidation may occur.
Technical analysis suggests RELIANCE could see a minimum target price of ₹2590 and a maximum of ₹3880 throughout the year. January starts with a target of ₹2590, gradually climbing to ₹3880 by June, and maintaining this level through December. This trajectory indicates a potential upward trend fueled by favorable market conditions.
Overall, RELIANCE’s forecasted share price for 2024 suggests a promising start, with the possibility of significant gains as the year progresses, culminating in a robust year-end target of ₹3880.
Also Read: Asian Paints Share Price target 2024, 2025 to 2030
RIL Share Price Target 2025
| Year | Reliance Industries Share Price Targets 2025 |
|---|---|
| 2025 | ₹3875-₹4590 |
According to our Experts, In 2025, the share price forecast for Reliance Industries Ltd suggests an initial target of ₹3875, with the potential for further growth throughout the year. By mid-year, with favorable market conditions and industry trends, the share price could reach around ₹4150. As the year progresses, the anticipated target for December 2025 is ₹4590, reflecting sustained bullish momentum.
Also Read: [JIOFIN] Jio Finance Share Price Target 2024, 2025, 2030, 2040 & 2050: A Complete Analysis Report
RIL Share Price Target 2030
| Year | Reliance Industries Share Price Targets 2030 |
|---|---|
| 2030 | ₹8000-₹9500 |
In 2030, Reliance Industries Ltd is forecasted to experience a dynamic trajectory in its share price, with initial projections setting a target of ₹8000 in January. Amidst favorable market conditions, a mid-year target of ₹8800 is anticipated, showcasing potential stability and growth. By December, the price target is expected to hover around ₹9500, indicative of sustained bullish market trends.
Also Read: Mukka Proteins Share Price Target 2024, 2025 to 2030
Reliance Industries Ltd. Share Analysis: Buy or Sell?
- PE Ratio (Price to Earnings): This ratio reflects how much investors are willing to pay for each rupee of earnings. Reliance Industries’ high PE ratio of 43.17 suggests it may be overvalued.
- Share Price: Reliance Industries’ current share price is Rs 2,850.50. Utilizing valuation calculators can help determine if the stock is undervalued or overvalued.
- ROA (Return on Assets): Reliance Industries’ ROA of 4.84% indicates its ability to generate profits from its asset investments, which appears relatively low.
- Current Ratio: Reliance Industries’ current ratio of 1.12 indicates its ability to cover short-term liabilities with short-term assets.
- ROE (Return on Equity): The ROE of 9.05% showcases the company’s ability to generate profits from shareholders’ investments, albeit it could be higher for better performance.
- Debt to Equity Ratio: With a D/E ratio of 0.45, Reliance Industries exhibits a low proportion of debt in its capital structure.
- Inventory Turnover Ratio: Reliance Industries’ inventory turnover ratio of 11.92 suggests potential inefficiency in managing inventory and working capital.
- Sales Growth: The reported revenue growth of 25.10% for Reliance Industries reflects fair performance and growth.
- Operating Margin: Reliance Industries’ operating margin of 12.20% indicates its operational efficiency.
- Dividend Yield: With a dividend yield of 0.32% based on a dividend of Rs 9, investors can assess the dividend payout in relation to the stock price.
Strengths
- The company demonstrates robust revenue growth, averaging 16.17% over the past three years.
- It maintains an efficient Cash Conversion Cycle of -71.09 days.
- The company exhibits effective cash flow management, with a CFO/PAT ratio of 1.24.
- With a significant promoter holding of 50.30%, the company enjoys strong support from its key stakeholders.
Who are the largest shareholders of RIL?
- Promoter Group (Reliance Industries Ltd): The promoter group, which is the Ambani family, is the largest shareholder of RIL, holding around 50.39% of the total shares.
- Life Insurance Corporation of India (LIC): LIC is the biggest non-promoter investor in RIL, with a stake of 6.49%.
- Other Institutional Investors: This category includes foreign institutional investors (FIIs), domestic institutional investors (DIIs), and mutual funds. They collectively hold around 43.12%.
FAQs
Disclaimer: Dear Readers, Please note, These stock price projections are based on factors like past performance and market trends. These projections are for informational purposes only and aren’t financial advice or guarantees.