
Today, we will explore the Cochin Shipyard Share Price Targets for 2024 to 2030. To know, how the stock will perform in the upcoming years, read this article complete.
Firstly, Let’s understand What is Cochin Shipyard Ltd. and What they do?
What is Cochin Shipyard Ltd.?
Cochin Shipyard Limited, established in 1972, is an Indian company specializing in shipbuilding and ship repair services. The company’s core activities encompass the construction, repair, and refurbishment of various types of vessels, ranging from defense ships like aircraft carriers and patrol vessels to commercial vessels such as oil tankers and bulk carriers.
Additionally, it provides offshore services including platform supply vessels and tug supply vessels. Cochin Shipyard also offers marine engineering training and advanced solutions. Shri. Madhu Nair serves as the Managing Director of the company, which is listed on the NSE under the symbol COCHINSHIP.
Company Profile
| Company type | Public |
| Traded as | BSE: 540678 NSE: COCHINSHIP |
| Industry | Shipbuilding |
| Founded | 29 April 1972; 51 years ago |
| Headquarters | Kochi, Kerala, India |
| Area served | India |
| Key people | Madhu S. Nair (Chairman & MD) |
| Products | – Aircraft Carrier – Tankers – Bulk carriers – Platform supply vessels – Patrol boats – Diving support vessels |
| Services | – Ship design – Shipbuilding – Ship repair – Marine Engineering Training Institute – Vigyana Sagar |
| Revenue | ₹2,536.94 crore (US$320 million) (FY 2023) |
| Operating income | ₹448.50 crore (US$56 million) (FY 2023) |
| Net income | ₹334.8 crore (US$42 million) (FY 2023) |
| Total assets | ₹9,909.04 crore (US$1.2 billion) (FY 2023) |
| Total equity | ₹4,423.41 crore (US$550 million) (FY 2023) |
| Owner | Government of India |
| Number of employees | 1,744 (March 2019) |
| Subsidiaries | – Hooghly Cochin Shipyard Limited – Udupi Cochin Shipyard Limited |
| Website | cochinshipyard.in |
Cochin Shipyard Ltd. Fundamentals Analysis
| MARKET CAP | ₹ 23,266.86 Cr. |
| ENTERPRISE VALUE | ₹ 18,720.88 Cr. |
| NO. OF SHARES | 26.31 Cr. |
| P/E | 39.05 |
| P/B | 4.69 |
| FACE VALUE | ₹ 5 |
| DIV. YIELD | 0.96 % |
| BOOK VALUE (TTM) | ₹ 188.65 |
| CASH | ₹ 4,671.81 Cr. |
| DEBT | ₹ 125.82 Cr. |
| PROMOTER HOLDING | 72.86 % |
| EPS (TTM) | ₹ 22.65 |
| SALES GROWTH | -26.94% |
| ROE | 7.62 % |
| ROCE | 10.85% |
| PROFIT GROWTH | -42.98% |
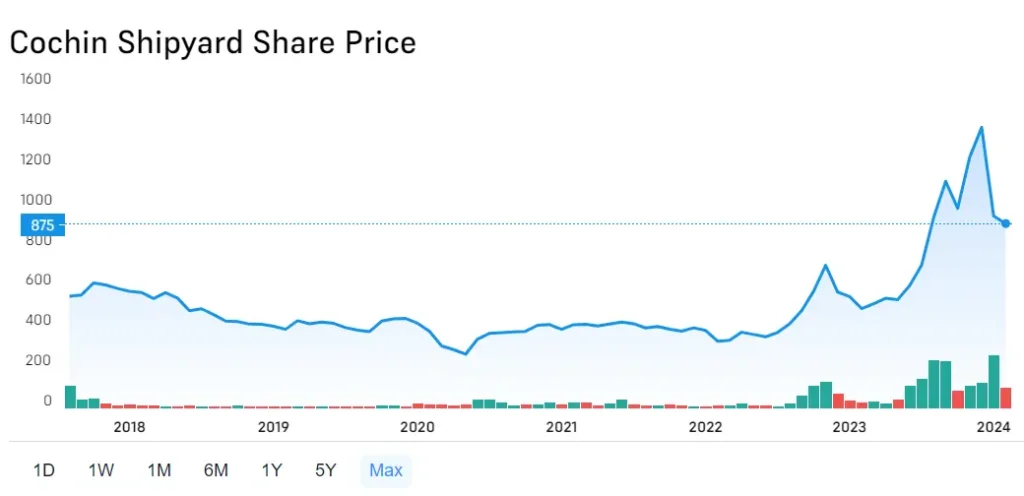
Cochin Shipyard Ltd. Share Price Growth Chart
Cochin Shipyard Ltd. Profit & Loss Analysis
| DATA | MAR 2019 | MAR 2020 | MAR 2021 | MAR 2022 | MAR 2023 |
|---|---|---|---|---|---|
| Net Sales | 2,965.60 | 3,422.49 | 2,818.90 | 3,190.00 | 2,330.46 |
| Total Expenditure | 2,391.93 | 2,708.28 | 2,091.64 | 2,555.11 | 2,057.32 |
| Operating Profit | 573.67 | 714.21 | 727.25 | 634.89 | 273.14 |
| Other Income | 227.28 | 247.50 | 193.86 | 266.42 | 206.49 |
| Interest | 15.43 | 49.56 | 57.46 | 52.51 | 41.79 |
| Depreciation | 34.16 | 48.73 | 53.07 | 54.41 | 51.15 |
| Exceptional Items | 0 | 0 | 0 | 0 | 61.81 |
| Profit Before Tax | 751.38 | 863.43 | 810.59 | 794.39 | 448.51 |
| Provision for Tax | 270.20 | 225.74 | 200.48 | 207.82 | 114.02 |
| Net Profit | 481.18 | 637.69 | 610.10 | 586.57 | 334.49 |
| Adjusted EPS (Rs.) | 18.29 | 24.24 | 23.19 | 22.30 | 12.71 |
Cochin Shipyard Ltd. Balance Sheet Analysis
| DATA | MAR 2019 | MAR 2020 | MAR 2021 | MAR 2022 | MAR 2023 |
|---|---|---|---|---|---|
| Equity and Liabilities | |||||
| Share Capital | 131.54 | 131.54 | 131.54 | 131.54 | 131.54 |
| Total Reserves | 3,200.54 | 3,600.25 | 3,846.03 | 4,227.64 | 4,291.88 |
| Borrowings | 123 | 123 | 123 | 125.82 | 23.02 |
| Other N/C liabilities | -38.72 | 358.35 | 339.27 | 357.16 | 379.69 |
| Current liabilities | 1,761.46 | 2,145.12 | 2,880.90 | 3,408.45 | 5,026 |
| Total Liabilities | 5,177.81 | 6,358.26 | 7,320.73 | 8,250.61 | 9,852.13 |
| Assets | |||||
| Net Block | 374.64 | 756.19 | 755.90 | 740.22 | 716.19 |
| Capital WIP | 341.08 | 768.21 | 1,061.64 | 1,224.16 | 1,587.47 |
| Intangible WIP | 0 | 0 | 0 | 23.04 | 16.02 |
| Investments | 60.37 | 65.45 | 214.45 | 261.58 | 335.61 |
| Loans & Advances | 332.75 | 354.24 | 261.05 | 232.28 | 216.25 |
| Other N/C Assets | 5.58 | 8.65 | 43.31 | 0.22 | 0.06 |
| Current Assets | 4,063.40 | 4,405.54 | 4,984.38 | 5,769.11 | 6,980.52 |
| Total Assets | 5,177.81 | 6,358.26 | 7,320.73 | 8,250.61 | 9,852.13 |
Equity and Liabilities:
- Total liabilities have increased from ₹5,177.81 Cr in Mar 2019 to ₹9,852.13 Cr in Mar 2023, an increase of 88.4%
Assets:
- Total assets have also increased from ₹5,177.81 Cr in Mar 2019 to ₹9,852.13 Cr in Mar 2023, an increase of 88.4%
Current liabilities:
- Current liabilities have increased from ₹1,761.46 Cr in Mar 2019 to ₹5,026 Cr in Mar 2023, an increase of 185.2%
Current assets:
- Current assets have also increased from ₹4,063.4 Cr in Mar 2019 to ₹6,980.52 Cr in Mar 2023, an increase of 71.8%
Cochin Shipyard Share Price Target 2024, 2025 to 2030
| Year | Minimum Price Target | Maximum Price Target |
|---|---|---|
| 2024 | ₹681.43 | ₹1562.07 |
| 2025 | ₹1560.68 | ₹2110.27 |
| 2026 | ₹2111.86 | ₹2455.95 |
| 2027 | ₹2454.83 | ₹2880.94 |
| 2028 | ₹2881.95 | ₹3103.98 |
| 2029 | ₹3104.73 | ₹3545.61 |
| 2030 | ₹3544.30 | ₹4250.15 |
Cochin Shipyard Share Price Target 2024
| Year | COCHINSHIP Share Price Target 2024 |
|---|---|
| 2024 | ₹681.43-₹1562.07 |
In 2023, many Indian stocks, including COCHINSHIP, saw significant growth. The bullish trend is expected to continue into the first quarter of 2024, although some consolidation may occur initially. Based on technical analysis, COCHINSHIP’s share price in 2024 is forecasted to range between ₹681.43 to ₹1562.07.
Also Read: [JIOFIN] Jio Finance Share Price Target 2024, 2025, 2030, 2040 & 2050: A Complete Analysis Report
Cochin Shipyard Share Price Target 2025
| Year | COCHINSHIP Share Price Target 2025 |
|---|---|
| 2025 | ₹1560.68-₹2110.27 |
By January 2025, the anticipated target for COCHINSHIP’s share price is ₹1560.68. However, as we progress through the year, with favorable market conditions, the price may dip slightly to around ₹1854.14 by mid-year. Towards the end of 2025, it’s expected to recover and potentially reach ₹2110.27, considering bullish market trends.
Also Read: TATA Investment Share Price Target 2024, 2025 to 2030
Cochin Shipyard Share Price Target 2030
| Year | COCHINSHIP Share Price Target 2030 |
|---|---|
| 2030 | ₹3544.30-₹4250.15 |
- The initial price target for Cochin Shipyard Ltd in 2030 is anticipated to be ₹3544.30.
- With favorable market conditions, the mid-year price target for Cochin Shipyard Ltd could potentially reach ₹3810.64.
- By the end of 2030, the price target for Cochin Shipyard Ltd is expected to potentially reach ₹4250.15, considering bullish market trends.
Also Read: Asian Paints Share Price target 2024, 2025 to 2030
Cochin Shipyard Ltd. Share Quick Analysis Report: Buy or Sell?
- Price-to-Earnings (P/E) Ratio: This ratio compares the share price to the company’s earnings per share, indicating how much investors are willing to pay for each unit of earnings. Cochin Shipyard’s P/E ratio of 38.66 suggests overvaluation.
- Share Price: Cochin Shipyard’s current share price is Rs 875.50 as of 19th March, 2023, which can be assessed for undervaluation or overvaluation using valuation calculators.
- Return on Assets (ROA): ROA measures the company’s ability to generate earnings from its assets. Cochin Shipyard’s ROA of 3.70% indicates relatively poor efficiency in asset utilization.
- Current Ratio: This ratio assesses the company’s ability to cover short-term liabilities with short-term assets. Cochin Shipyard’s current ratio of 1.39 indicates stability but may be vulnerable to unexpected economic challenges.
- Return on Equity (ROE): ROE reflects the company’s ability to generate profits from shareholders’ investments. Cochin Shipyard’s ROE of 7.62% is relatively low, suggesting suboptimal profitability.
- Debt-to-Equity (D/E) Ratio: This metric evaluates the company’s capital structure. Cochin Shipyard’s low D/E ratio of 0.03 indicates a minimal proportion of debt in its capital.
- Inventory Turnover Ratio: This ratio evaluates inventory management efficiency. Cochin Shipyard’s inventory turnover ratio of 7.30 suggests inefficiency in managing inventory and working capital.
- Sales Growth: Cochin Shipyard’s reported revenue growth of -26.94% indicates poor performance in revenue generation.
- Operating Margin: This metric assesses operational efficiency. Cochin Shipyard’s operating margin of 11.72% indicates moderate operational efficiency.
- Dividend Yield: Cochin Shipyard’s dividend yield of 0.96% indicates the dividend payout in relation to the stock price.
👍 Strengths
- The company operates with virtually no debt.
- It maintains a healthy interest coverage ratio of 11.73.
- An efficient cash conversion cycle of 48.41 days indicates effective management of cash flow.
- The company demonstrates strong cash flow management with a CFO/PAT ratio of 1.49.
- High promoter holding of 72.86% signifies strong internal support and stability.
👎 Weakness
- Over the past 3 years, the company has experienced a negative profit growth of -19.35%.
- Revenue growth has been poor, declining by -12.02% over the same period.
- The company faces contingent liabilities amounting to 1,734.34 Cr.
Cochin Shipyard Ltd. Q3 Result
FAQs
Disclaimer: Dear Readers, Please note, These stock price projections are based on factors like past performance and market trends. These projections are for informational purposes only and aren’t financial advice or guarantees.