
In, Today’s blog, we will explore the Olectra Greentech Share Price Targets for 2024 to 2030. To know how the stock will perform in the upcoming years, read the complete article.
What is Olectra GreenTech Ltd.?
Olectra Greentech Limited, an India-based company, specializes in the production of composite polymer insulators and electric buses. The company operates across three key segments: Insulator division, e-bus division, and e-truck division. Its product range includes Power Insulators and Electric Buses, with flagship models such as the K9, K7, and K6 buses, offering customizable seating options for long-range travel.
Notably, the company has deployed its C9 buses for the Puri Bus Service, featuring a 49-seater 12-meter bus tailored for intercity journeys. Additionally, it offers various transmission and distribution composite insulators.
With a strong presence, the company has over 1000 electric buses in commercial operation throughout India. Established in 2000, Olectra Greentech Limited is led by Managing Director Mr. Venketeswara Karumuru.
Olectra GreenTech Ltd. Fundamental Analysis
| Market Cap (Cr) | 14273.43 |
| Enterprise Value (Cr) | 14176.71 |
| No. of Shares (Cr) | 8.21 |
| P/E | 159 |
| P/B | 15.73 |
| Face Value (₹) | 4 |
| Div. Yield (%) | 0.02 |
| Book Value (TTM) (₹) | 110.54 |
| Cash (Cr) | 165.72 |
| Debt (Cr) | 69 |
| Promoter Holding (%) | 50.02 |
| EPS (TTM) (₹) | 10.94 |
| Sales Growth (%) | 93.77 |
| ROE (%) | 8.68 |
| ROCE (%) | 13.86 |
| Profit Growth (%) | 98.06 |
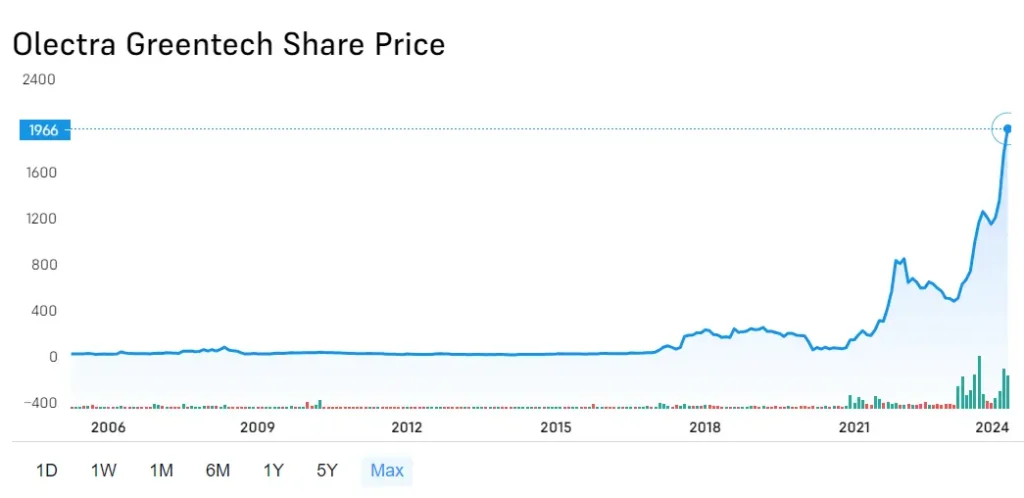
Olectra GreenTech Ltd. Share Price Growth
Olectra GreenTech Ltd. Profit & Loss Report
| DATA | MAR 2019 | MAR 2020 | MAR 2021 | MAR 2022 | MAR 2023 |
|---|---|---|---|---|---|
| Net Sales (Cr.) | 290.30 | 395.53 | 277.22 | 585.43 | 1,134.41 |
| Total Expenditure | 304.09 | 386.44 | 256.35 | 504.57 | 1,005.75 |
| Operating Profit | -13.78 | 9.09 | 20.88 | 80.86 | 128.65 |
| Other Income | 15.13 | 26.39 | 11.43 | 7.87 | 19.97 |
| Interest | 14.93 | 13.79 | 7.43 | 9.27 | 31.18 |
| Depreciation | 6.22 | 8.83 | 8.89 | 24.85 | 26.34 |
| Exceptional Items | 0 | 0.50 | 0 | -2.55 | 0 |
| Profit Before Tax | -19.80 | 13.35 | 15.99 | 52.07 | 91.11 |
| Tax | -6.23 | 2.65 | 3.78 | 16.37 | 20.41 |
| Net Profit | -13.58 | 10.70 | 12.21 | 35.70 | 70.70 |
| Adjusted EPS (Rs.) | -1.71 | 1.30 | 1.49 | 4.35 | 8.61 |
Revenue Growth:
- The company has experienced impressive sales growth, with net sales jumping from Rs. 290.3 Cr in March 2019 to Rs. 1134.41 Cr in March 2023. This translates to a remarkable increase of approximately 290% over the period.
Profitability:
- The company initially reported losses, with a net loss of Rs. 13.58 Cr in March 2019.
- However, a turnaround occurred by March 2020, with a net profit of Rs. 10.70 Cr.
- Profitability has steadily improved since then, reaching Rs. 70.70 Cr in March 2023.
Olectra GreenTech Ltd. Balance Sheet Analysis
| Balance Sheet | MAR 2019 | MAR 2020 | MAR 2021 | MAR 2022 | MAR 2023 |
|---|---|---|---|---|---|
| Equity and Liabilities | |||||
| Share Capital | 31.75 | 32.83 | 32.83 | 32.83 | 32.83 |
| Total Reserves | 673.47 | 699.16 | 711.43 | 748.22 | 815.79 |
| Borrowings | 3.48 | 2.83 | 3.93 | 52.08 | 9.25 |
| Other N/C liabilities | -6.32 | 8.52 | 5.92 | 33.61 | 42.99 |
| Current liabilities | 153.91 | 146.34 | 143.72 | 299.79 | 601.77 |
| Total Liabilities | 856.28 | 889.68 | 897.83 | 1,166.54 | 1,502.63 |
| Assets | |||||
| Net Block | 101.72 | 105.88 | 249.25 | 288.86 | 273.89 |
| Capital WIP | 0 | 0 | 0 | 1.27 | 3.82 |
| Intangible WIP | 0 | 0 | 0 | 0 | 0 |
| Investments | 5.01 | 0.01 | 32.24 | 32.25 | 34.59 |
| Loans & Advances | 11.80 | 12.71 | 14.45 | 13.63 | 21.73 |
| Other N/C Assets | 0.11 | 0.07 | 47.89 | 65.11 | 34.40 |
| Current Assets | 737.64 | 771.00 | 554.01 | 765.42 | 1,134.19 |
| Total Assets | 856.28 | 889.68 | 897.83 | 1,166.54 | 1,502.63 |
Capital Structure:
- Equity: Share capital has remained constant at Rs. 32.83 Cr over the five years.
Olectra Greentech Share Price Target 2024, 2025 to 2030
Olectra Greentech Share Price Target 2024
| Year | Olectra Share Price Target 2024 |
|---|---|
| 2024 | Rs.1700- Rs. 2200 |
Bullish Factors:
- Industry Tailwinds: The Indian government’s push for electric vehicles and rising fuel prices are strong tailwinds for Olectra Greentech.
- Strong Sales Growth: The company boasts impressive sales growth, exceeding 93% year-on-year.
- Profit Surge: Profitability has also witnessed a significant rise, exceeding 98% year-over-year.
- New Orders: Recent contract wins for supplying electric buses further bolster Olectra Greentech’s position.
Points to Consider:
- Inventory Management: The current inventory turnover ratio suggests potential inefficiencies in managing inventory.
- Low ROE: The Return on Equity (ROE) is on the lower side, which might be a concern for some investors.
- High PE Ratio: The current PE ratio is significantly higher than the historical average, indicating the stock might be overvalued.
Prediction:
Brokerage firms & Market Experts have provided a target price of ₹1,700–₹2,200 for Olectra Greentech, reflecting a potential downside from the current price.
Also Read: Teamlease Services Share Price Target 2024, 2025 to 2030
Olectra Greentech Share Price Target 2025
| Year | Olectra Share Price Target 2025 |
|---|---|
| 2025 | Rs.2200-Rs. 2680 |
Also Read: Suryoday Small Finance Bank Share Price Target 2024, 2025 to 2030
Olectra Greentech Share Price Target 2030
| Year | Olectra Share Price Target 2030 |
|---|---|
| 2030 | Rs. 5000-Rs.6000 |
Also Read: [JIOFIN] Jio Finance Share Price Target 2024, 2025, 2030, 2040 & 2050
Olectra GreenTech Ltd. Share Quick Analysis Report: Buy Or Sell?
This analysis provides insights into Olectra Greentech, a company in the Indian auto sector, specifically focusing on electric vehicles.
Industry:
- The Indian auto industry is a major player globally, ranking among the top 5.
- Strong export growth is expected, supported by government initiatives.
Olectra Greentech Performance:
- Sales: Strong sales growth of 93.77%, with the latest quarter at Rs. 331.95 Cr.
- Inventory Turnover: Ratio of 11.30 suggests potentially poor inventory management, meaning sold inventory is not being replaced efficiently.
- Profit: Profit growth of 98.06% year-over-year, with the latest profit at Rs. 70.70 Cr.
- Operating Profit: Rs. 47.14 Cr in the latest quarter, indicating good operational performance.
- Return on Equity (ROE): Low ROE of 8.68% might be a concern for auto companies that typically require high equity investment.
- Debt to Equity Ratio: Low ratio of 0.08 suggests minimal debt financing, which can be positive.
- Dividends: Low dividend yield of 0.02% and Rs. 0.40 per share payout indicate a low focus on shareholder profit sharing.
- Promoter Holding: High promoter holding of 50.02% with no pledging suggests strong control by the founding group.
- Price-to- Earnings (PE) Ratio: Current PE of 156.75 is significantly higher than the 5-year average of 81.35, indicating the stock might be overvalued.
👍 Strengths
- The company has demonstrated robust profit growth, achieving an impressive 87.64% increase over the past three years.
- Significant revenue growth of 42.08% has been consistently recorded by the company over the same period.
- The company maintains a virtually debt-free status, contributing to its financial stability and flexibility.
- Demonstrating operational efficiency, the company boasts a commendable Cash Conversion Cycle of 51.04 days.
- A strong promoter holding of 50.02% indicates confidence and commitment towards the company’s growth trajectory.
👎 Weakness
- Despite positive growth trends, the company exhibits a relatively low Return on Equity (ROE) of 5.02% over the past three years.
- Trading at a high Price-to-Earnings (PE) ratio of 159, the company’s valuation may be considered elevated.
- Similarly, the company is trading at a high Enterprise Value-to-EBITDA (EV/EBITDA) ratio of 76.87, which suggests a potentially overvalued position.
FAQs
Disclaimer: Dear Readers, Please note, These stock price projections are based on factors like past performance and market trends. These projections are for informational purposes only and aren’t financial advice or guarantees.