Hindalco Industries Limited, a titan in the Indian metals industry, has consistently captured investor attention. But where does its future lie?
Let’s delve into the company’s past performance, technical indicators, and broader market forces to paint a picture of potential Hindalco share price targets for 2024, 2025, and even 2030.
About Hindalco Industries Ltd.
Hindalco Industries Limited, India’s leading metals company, specializes in manufacturing and distributing aluminium, copper, and related products worldwide.
Operating through segments like Novelis, Aluminium Upstream, Aluminium Downstream, and Copper, it spans four continents: North America, South America, Europe, and Asia.
Hindalco’s diverse offerings include flat rolled products, extrusions, and copper cathodes, under renowned brands like Eternia and Birla Copper.
Company Profile
| Company | Hindalco Industries Ltd. |
|---|---|
| Company Type | Public |
| Traded As | BSE: 500440, NSE: HINDALCO |
| Nifty 50 Constituent | Yes |
| ISIN | INE038A01020 |
| Industry | Metals |
| Founded | 1958 (66 years ago) |
| Headquarters | Mumbai, Maharashtra, India |
| Area Served | Worldwide |
| Key People | Kumar Mangalam Birla (Chairman), Satish Pai (Managing Director) |
| Products | Aluminium and copper products |
| Revenue | ₹224,459 crore (US$28 billion) (2023) |
| Operating Income | ₹22,666 crore (US$2.8 billion) (2023) |
| Net Income | ₹10,097 crore (US$1.3 billion) (2023) |
| Total Assets | ₹224,817 crore (US$28 billion) (2023) |
| Total Equity | ₹94,817 crore (US$12 billion) (2023) |
| Employees | ~76,800+ (Including 54,066 of India Operations) (2023) |
| Parent | Aditya Birla Group |
| Subsidiaries | Novelis, Aleris |
| Website | hindalco.com |
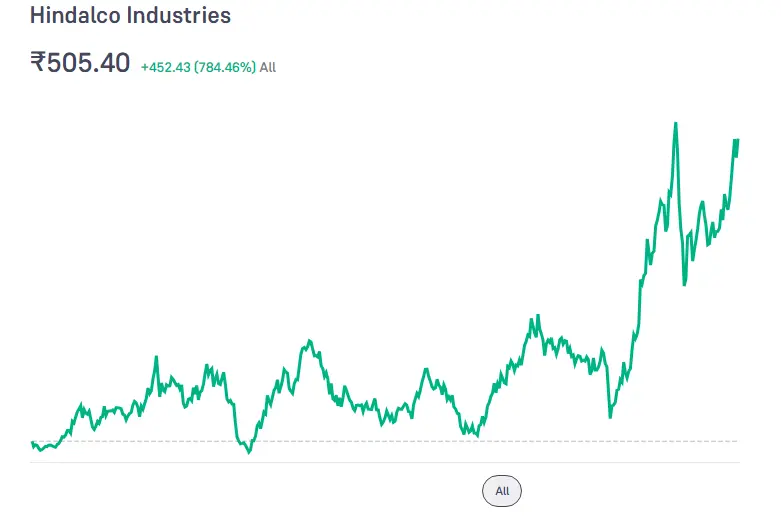
Hindalco boasts a rich history of growth. In the past five years, its share price has climbed over 80%, showcasing investor confidence. Strong financials support this ascent.
Revenue reached ₹224,459 crore in 2023, with a healthy operating income and net income. However, recent quarters have seen profit dips, highlighting the cyclical nature of the metals industry.
Technicals:
Technical analysis offers insights into potential price movements. Current charts indicate consolidation after a bullish run, suggesting a period of stability before the next leg up. Support levels around ₹500 and resistance near ₹550 could guide short-term movements.
Markets:
External factors significantly influence metal prices and, consequently, Hindalco’s performance. Global economic health, commodity demand, and government policies are crucial elements. Positive signs like infrastructure spending in India and recovering demand from China could bode well. However, rising interest rates and geopolitical tensions pose challenges.
Hindalco Industries Ltd. Fundamentals
| Fundamentals | Value |
|---|---|
| MARKET CAP | ₹ 1,13,214.77 Cr. |
| ENTERPRISE VALUE | ₹ 1,29,368.77 Cr. |
| NO. OF SHARES | 224.72 Cr. |
| P/E | 40.77 |
| P/B | 1.87 |
| FACE VALUE | ₹ 1 |
| DIV. YIELD | 0.59 % |
| BOOK VALUE (TTM) | ₹ 269.35 |
| CASH | ₹ 1,789 Cr. |
| DEBT | ₹ 17,943 Cr. |
| PROMOTER HOLDING | 34.64 % |
| EPS (TTM) | ₹ 12.36 |
| SALES GROWTH | 13.64% |
| ROE | 5.87 % |
| ROCE | 8.04% |
| PROFIT GROWTH | -39.60 % |
Hindalco Industries Ltd. Profit & Loss Report (Last 5 Years)
| Details | MAR 2019 (Cr.) | MAR 2020 (Cr.) | MAR 2021 (Cr.) | MAR 2022 (Cr.) | MAR 2023 (Cr.) |
|---|---|---|---|---|---|
| Net Sales | 45,749 | 40,242 | 42,701 | 67,653 | 76,878 |
| Total Expenditure | 41,737 | 36,649 | 38,910 | 56,631 | 69,604 |
| Operating Profit | 4,012 | 3,593 | 3,791 | 11,022 | 7,274 |
| Other Income | 1,174 | 810 | 967 | 685 | 687 |
| Interest | 1,683 | 1,679 | 1,483 | 1,391 | 1,253 |
| Depreciation | 1,693 | 1,708 | 1,708 | 1,752 | 1,874 |
| Exceptional Items | 0 | -647 | -1,074 | 1 | 41 |
| Profit Before Tax | 1,810 | 952 | 1,574 | 8,457 | 4,875 |
| Tax | 605 | 332 | 581 | 2,950 | 1,549 |
| Net Profit | 1,205 | 620 | 993 | 5,507 | 3,326 |
| Adjusted EPS (Rs.) | 5.43 | 2.79 | 4.47 | 24.81 | 14.98 |
- Past Performance: Hindalco witnessed a steady upward trend in 2023, but recent quarters saw profit dips.
- Technical Outlook: Consolidation phase expected after a bullish run. Support level around ₹500, resistance near ₹550.
- Market Conditions: Global economic recovery, infrastructure spending in India, and rising commodity demand might boost the price. However, interest rate hikes and geopolitical tensions pose challenges.
- Target Range: Experts predict ₹588.95 – ₹708.58. Volatility might cause fluctuations.
Key Factors to Watch:
- Performance of key aluminum and copper markets: Continued demand from construction and automotive sectors will be crucial.
- Company’s cost management strategies: Efficiency improvements can offset potential margin pressures.
- Progress on expansion plans: Successful project completion can unlock future growth potential.
Also Read: Mahan Industries Share Price Target 2024, 2025 to 2030
- Building on 2024 Momentum: If positive trends from 2024 continue, a bullish sentiment could push the price towards ₹748.45.
- Potential Consolidation: After potential gains in 2024, a period of consolidation is possible, adjusting to new price levels.
- Focus Shifts: Continued focus on cost management and diversification into high-growth segments like aerospace and electric vehicles will be crucial.
- Target Range: Mid-year target of ₹748.41, followed by consolidation around ₹748.45.
Key Factors to Watch:
- Global trade wars and their impact on commodity prices: Trade policies can significantly affect metal prices.
- Progress on sustainability initiatives: Increasing focus on sustainability aligns with global demands and can attract investors.
- Government policies impacting the metals industry: Supportive policies can accelerate industry growth.
Also Read: SBI Share Price Target 2024, 2025, 2030, 2040, 2050
- Long-Term Vision: Reaching targets of ₹1050 – ₹1150 hinges on sustained growth and market stability.
- Focus on Innovation: Continuous innovation in product development and production processes will be vital for long-term success.
- Expanding Geographic Reach: Expanding into new markets and strengthening global presence can fuel growth.
- Target Range: ₹1000 – ₹1100, representing long-term potential, achievable with consistent growth and favorable market conditions.
Key Factors to Watch:
- Shifting global energy landscape: Transition towards renewable energy could impact demand for some metals.
- Technological advancements: Technological disruptions in the metals industry can open up new opportunities.
- Geopolitical stability: Global stability is crucial for smooth supply chains and market confidence.
Also Read: [JIOFIN] Jio Finance Share Price Target 2024, 2025, 2030, 2040 & 2050: A Complete Analysis Report
Year Wise Table
| Year | Minimum Target | Maximum Target |
|---|---|---|
| 2024 | ₹530 | ₹720 |
| 2025 | ₹680 | ₹780 |
| 2026 | ₹750 | ₹850 |
| 2027 | ₹820 | ₹920 |
| 2028 | ₹900 | ₹1,000 |
| 2029 | ₹980 | ₹1,080 |
| 2030 | ₹1,050 | ₹1,150 |
Hindalco Industries Ltd. Stock Analysis Report
Stock investing requires thorough analysis of financial data to determine a company’s true value. While examining profit/loss, balance sheets, and cash flow statements can be tedious, financial ratios offer a simpler approach to assess performance.
- PE Ratio: Hindalco’s PE ratio of 41.28 indicates overvaluation.
- Share Price: Currently at Rs 510.10, use valuation calculators to gauge undervaluation.
- ROA: Hindalco’s ROA of 3.39% signals poor future performance.
- Current Ratio: With 1.72, Hindalco demonstrates stability in meeting short-term liabilities.
- ROE: At 5.87%, Hindalco’s ROE reflects profitability from shareholder investments.
- Debt to Equity Ratio: With 0.31, Hindalco maintains a low debt-to-equity ratio.
- Inventory Turnover Ratio: At 3.74, Hindalco’s management shows inefficiency in inventory and working capital management.
- Sales Growth: Reported revenue growth of 13.64% is considered poor.
- Operating Margin: Hindalco’s operating margin for the current financial year is 9.46%.
- Dividend Yield: Hindalco’s current year dividend is Rs 3, yielding 0.59%.
Hindalco Industries Ltd. strengths & weakness
Strengths
- Over the past three years, the company has demonstrated impressive profit growth of 75.06%.
- Achieved a notable revenue growth of 24.08% over the same period.
- Maintains an efficient Cash Conversion Cycle of 31.93 days.
- Demonstrates effective cash flow management, with CFO/PAT ratio standing at 1.85.
Weakness
- Despite its strengths, the company has recorded a low ROE of 6.16% over the past three years.