
Explore the future trajectory of Tech Mahindra’s stock as we delve into its potential Tech Mahindra share price targets for 2024, 2025, and 2030. In this detailed overview, we’ll examine the factors influencing these projections and provide insights into what lies ahead for this prominent player in the information technology industry.
About Tech Mahindra Ltd.
Tech Mahindra is an Indian multinational company specializing in information technology services and consulting. A subsidiary of the Mahindra Group, it is headquartered in Pune with its registered office in Mumbai. With a workforce of over 146,000 employees spanning 90 countries, Tech Mahindra is a prominent player in the industry. Notably, the company ranked #5 among India’s IT firms and secured the 47th position on the Fortune India 500 list in 2019.
In a significant development, Tech Mahindra completed a merger with Mahindra Satyam on 25 June 2013, consolidating its position in the market. Recognized as one of the top Big Tech companies in India, Tech Mahindra boasts 1,262 active clients as of June 2022.
Company Profile
| Company type | Public |
| Traded as | BSE: 532755 NSE: TECHM |
| ISIN | INE669C01036 |
| Industry | Information technology, Consulting, Outsourcing |
| Founded | 24 October 1986; 37 years ago |
| Founder | Anand Mahindra |
| Headquarters | Pune, Maharashtra, India |
| Area served | Worldwide |
| Key people | Anand Mahindra (Chairman), Mohit Joshi (MD & CEO) |
| Revenue | ₹53,255 crore (US$6.7 billion) (2023) |
| Operating income | ₹5,835 crore (US$730 million) (2023) |
| Net income | ₹4,831 crore (US$610 million) (2023) |
| Total assets | ₹46,153 crore (US$5.8 billion) (2023) |
| Total equity | ₹27,924 crore (US$3.5 billion) (2023) |
| Number of employees | 146,250 (December 2023) |
| Parent | Mahindra Group |
| Website | www.techmahindra.com |
Tech Mahindra Ltd. Fundamental Analysis
| Market Cap | ₹ 1,27,249.03 Cr. |
| Enterprise Value | ₹ 1,26,045.23 Cr. |
| Number of Shares | 97.64 Cr. |
| P/E Ratio | 55.86 |
| P/B Ratio | 5.36 |
| Face Value | ₹ 5 |
| Dividend Yield | 3.84 % |
| Book Value (TTM) | ₹ 243.36 |
| Cash | ₹ 1,203.80 Cr. |
| Debt | ₹ 0 Cr. |
| Promoter Holding | 35.11 % |
| EPS (TTM) | ₹ 23.33 |
| Sales Growth (TTM) | 19.28 % |
| ROE (TTM) | 14.92 % |
| ROCE (TTM) | 18.88 % |
| Profit Growth (TTM) | -24.80 % |
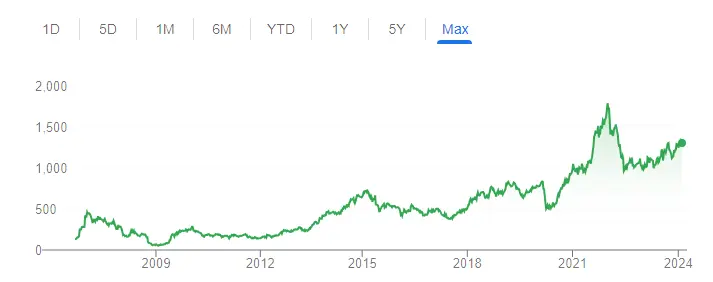
Tech Mahindra Ltd. Share Price Chart (All Time)
Tech Mahindra Ltd. Profit & Loss – Last 5 Years
| Profit & Loss | MAR 2019 (Cr.) | MAR 2020 (Cr.) | MAR 2021 (Cr.) | MAR 2022 (Cr.) | MAR 2023 (Cr.) |
|---|---|---|---|---|---|
| Net Sales | 27,228.10 | 29,225.40 | 29,640.90 | 35,761.10 | 42,657.30 |
| Total Expenditure | 22,059 | 25,525.30 | 24,310.60 | 30,130.50 | 37,887.80 |
| Operating Profit | 5,169.10 | 3,700.10 | 5,330.30 | 5,630.60 | 4,769.50 |
| Other Income | 959.80 | 2,366.20 | 921.80 | 1,607.70 | 1,128.30 |
| Interest | 43.10 | 66.70 | 63.20 | 68.90 | 180.80 |
| Depreciation | 659.20 | 667.40 | 662.30 | 740.30 | 812.90 |
| Exceptional Items | 0 | 0 | 0 | 0 | 0 |
| Profit Before Tax | 5,426.60 | 5,332.20 | 5,526.60 | 6,429.10 | 4,904.10 |
| Provision for Tax | 1,046.90 | 797.70 | 1,287.50 | 1,405.80 | 1,126.60 |
| Net Profit | 4,379.70 | 4,534.50 | 4,239.10 | 5,023.30 | 3,777.50 |
| Adjusted EPS (Rs.) | 44.54 | 46.95 | 43.78 | 51.69 | 38.78 |
Tech Mahindra Share Price Target 2024, 2025 and 2030
- Experts generally offer a bullish to moderately bullish outlook for TECHM’s share price in the coming years.
- Most targets for 2024 and 2025 fall within a range of ₹1,700 to ₹2,400.
- Longer-term forecasts for 2030 show wider ranges but indicate further potential growth, with some reaching as high as ₹2,843.96.
Key Drivers:
- Strong IT spending growth, particularly in cloud services and digital transformation.
- TECHM’s global presence and diversified portfolio offering resilience against market fluctuations.
- 5G adoption and expansion into new areas like cybersecurity and artificial intelligence.
Challenges:
- Rising costs due to wage inflation and geopolitical tensions.
- Talent acquisition and competition in the IT industry.
- Potential macroeconomic headwinds and margin pressure.
Tech Mahindra Share Price Target 2024
Experts hold a generally bullish outlook for Tech Mahindra’s (TECHM) share price in 2024, with targets ranging from ₹1,355.38 to ₹1,600. However, it’s crucial to remember that these are just predictions, and the actual price could deviate significantly.
Tech Mahindra Share Price Target 2025
Similar to 2024, experts project a bullish to moderately bullish outlook for Tech Mahindra’s (TECHM) share price in 2025. However, remember, these are predictions, and the actual price could significantly differ.
- Price Targets: ₹1,500 to ₹1,800, with some outliers reaching as high as ₹2,431.47.
Tech Mahindra Share Price Target 2030
Possible range: Around ₹4,400. This single point estimate suggests more confidence in the average price, but the actual price could still be above or below this mark.
Tech Mahindra Share Price Targets: Expert Opinions for 2024-2030
Similar to Mahindra & Mahindra, Tech Mahindra’s (TECHM) future share price is subject to various expert opinions and predictions. Here’s a summary of what some notable analysts and financial institutions are saying:
2024:
- Motilal Oswal: Bullish, with a target price of ₹1900 by December 2024. They cite strong IT spending, digital transformation trends, and TECHM’s global presence as key drivers.
- CLSA: Moderately bullish, with a target price of ₹1800 by December 2024. They acknowledge potential challenges like wage inflation and geopolitical tensions but believe TECHM’s diversified portfolio and client base will mitigate them.
- Edelweiss: Cautiously optimistic, with a target price of ₹1750 by December 2024. They highlight concerns about rising interest rates and the overall IT industry slowdown but see TECHM’s strong delivery track record and focus on cloud services as positive factors.
2025 and Beyond:
- Kotak Mahindra Securities: Bullish, with a target price of ₹2400 by December 2025. They expect TECHM to benefit from continued IT spending growth, 5G adoption, and expansion into new areas like cybersecurity and artificial intelligence.
- ICICI Direct: Moderately bullish, with a target price of ₹2200 by December 2025. They see potential challenges in the form of talent acquisition and competition but believe TECHM’s strong brand and client relationships will help them navigate these obstacles.
- JPMorgan Chase: Neutral, with a target price of ₹1950 by December 2025. They acknowledge TECHM’s strong capabilities but express concerns about potential macroeconomic headwinds and margin pressure.
Conclusion:
- Most experts are bullish to moderately bullish on TECHM’s long-term prospects.
- Factors like IT spending growth, digital transformation, and cloud services are seen as key drivers.
- Some concerns exist regarding rising costs, competition, and economic headwinds.
Tech Mahindra Share Analysis Report: s Tech Mahindra a Good Investment?
Investing in stocks requires thorough analysis of financial data to determine a company’s true value. This typically involves examining its profit and loss statement, balance sheet, and cash flow statement. However, a quicker way to assess a company’s performance is by looking at its financial ratios, which help make sense of complex financial information.
Here are some essential tools for every investor’s research process:
- PE Ratio: The Price to Earnings (PE) ratio indicates how much investors are willing to pay for a share relative to its earnings. Tech Mahindra’s PE ratio of 55.83 suggests that its stock may be overvalued.
- Share Price: Tech Mahindra’s current share price is Rs 1,302.55. Using valuation calculators, investors can determine if the stock is undervalued or overvalued.
- Return on Assets (ROA): This metric measures a company’s ability to generate income from its assets. Tech Mahindra’s ROA of 10.66% indicates its efficiency in converting asset investments into profits.
- Current Ratio: This ratio assesses a company’s ability to cover short-term liabilities with its short-term assets. Tech Mahindra’s current ratio of 2.07 suggests its stability in handling unexpected business and economic challenges.
- Return on Equity (ROE): ROE measures a firm’s profit generation from shareholder investments. Tech Mahindra’s ROE of 14.92% reflects its ability to generate profits from shareholder equity.
- Debt to Equity Ratio: This metric indicates the proportion of debt in a company’s capital structure. Tech Mahindra’s D/E ratio of 0 indicates a low level of debt.
- Sales Growth: Tech Mahindra has reported revenue growth of 19.28%, indicating fair growth and performance.
- Operating Margin: This metric reveals a company’s operational efficiency. Tech Mahindra’s operating margin for the current fiscal year is 11.18%.
- Dividend Yield: The dividend yield reflects the dividend relative to the stock price. Tech Mahindra’s dividend yield is 3.84%, with a current year dividend of Rs 50 per share.
Strengths
- The company operates with virtually no debt burden.
- Maintains a robust dividend yield of 4.03%.
- Demonstrates an effective cash conversion ratio of 108.59.
Weakness
- Over the past three years, the company has recorded poor profit growth of -5.91%.
- Bears contingent liabilities amounting to 10,443.20 Cr.
Disclaimer: Please note, stock price projections for Mahindra and Mahindra (M&M) in 2024, 2025, and 2030 are based on factors like past performance and market trends. However, investing involves risks, and past performance doesn't guarantee future results. These projections are for informational purposes only and aren't financial advice or guarantees. It's essential to research and consult with experts before making investment decisions.
Recommended Articles: