
Step into the future with our blog post on Mercury EV-Tech share price targets for 2024, 2025, 2030, 2040, and 2050. Join us as we analyze the factors influencing their growth trajectory. Whether you’re an investor or simply curious about electric vehicle trends, this analysis will provide valuable insights into the company’s potential.
About Mercury EV-Tech Ltd.
Mercury Ev-Tech is an Indian company that makes electric vehicles like scooters, cars, buses, vintage cars, and golf carts. They also create customized electric vehicles for different uses like in hotels, industries, golf courses, and clubs.
They have their own manufacturing facility for making important parts like batteries and chassis, and they also have assembly lines for putting everything together. You might know their electric scooters by the name Thunderbolt, and their three-wheeled vehicles are branded as Thunderbolt DODO and Thunderbolt LIMOSA.
The company was founded back in 1986 and is led by Mr. Kavit Thakkar. They also have some subsidiary companies called EV Nest Private Limited and Powermets Energy Private Limited.
Mercury EV-Tech Share Price Target 2024, 2025, 2030, 2040, 2050
Forecasting share price targets for Mercury EV-Tech over the coming decades involves a variety of technical analysis, fundamental evaluation, and consideration of broader industry trends. Here’s an overview of projected share price targets for the years 2024, 2025, 2030, 2040, and 2050:
Mercury EV-Tech Ltd. Fundamental Analysis
| Market Cap | ₹ 1,589.23 Cr. |
| Enterprise Value | ₹ 1,602.55 Cr. |
| No. of Shares | 17.55 Cr. |
| P/E | 697.46 |
| P/B | 19.88 |
| Face Value | ₹ 1 |
| Div. Yield | 0% |
| Book Value (TTM) | ₹ 4.55 |
| Cash | ₹ 8.98 Cr. |
| Debt | ₹ 22.29 Cr. |
| Promoter Holding | 62.56% |
| EPS (TTM) | ₹ 0.13 |
| Sales Growth | 1,035.35% |
| ROE | 3.45% |
| ROCE | 3.03% |
| Profit Growth | 281.12% |
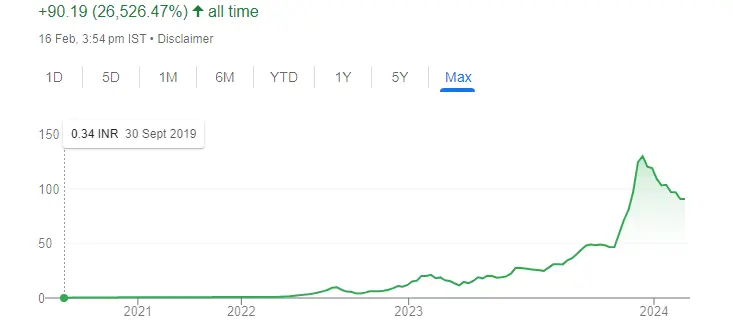
Mercury EV-Tech Ltd. Share Price Chart (All Time)
Mercury EV-Tech Ltd. Profit & Loss – Last 5 Years
| Profit & Loss | MAR 2019 (Cr.) | MAR 2020 (Cr.) | MAR 2021 (Cr.) | MAR 2022 (Cr.) | MAR 2023 (Cr.) |
|---|---|---|---|---|---|
| Net Sales (Cr.) | 0.83 | 0 | 1.15 | 1.18 | 13.42 |
| Total Expenditure (Cr.) | 0.95 | 0.14 | 1.27 | 0.91 | 12.30 |
| Operating Profit (Cr.) | -0.12 | -0.14 | -0.12 | 0.28 | 1.12 |
| Other Income (Cr.) | 0 | 0.01 | 0.03 | 0.04 | 0.04 |
| Interest (Cr.) | 0 | 0 | 0 | 0 | 0.02 |
| Depreciation (Cr.) | 0 | 0 | 0 | 0 | 0.05 |
| Exceptional Items (Cr.) | 0 | 0 | 0 | 0 | 0 |
| Profit Before Tax (Cr.) | -0.12 | -0.13 | -0.09 | 0.32 | 1.09 |
| Tax (Cr.) | 0 | -0.01 | 0 | 0.09 | 0.21 |
| Net Profit (Cr.) | -0.12 | -0.13 | -0.09 | 0.23 | 0.88 |
| Adjusted EPS (Rs.) | -0.06 | -0.07 | -0.05 | 0.12 | 0.05 |
Mercury EV-Tech Share Price Target 2024
| Month | Minimum Stock Price | Maximum Stock Price |
|---|---|---|
| January | 90 | 140 |
| February | 112 | 142 |
| March | 115 | 145 |
| April | 118 | 148 |
| May | 120 | 150 |
| June | 122 | 152 |
| July | 125 | 155 |
| August | 128 | 158 |
| September | 130 | 160 |
| October | 132 | 162 |
| November | 135 | 165 |
| December | 138 | 168 |
Also Read: IEX Share Price Target 2024, 2025, 2030, 2040, 2050: A Complete Analysis
Mercury EV-Tech Share Price Target 2025
| Month | Minimum Stock Price | Maximum Stock Price |
|---|---|---|
| January | 120 | 160 |
| February | 122 | 162 |
| March | 125 | 165 |
| April | 128 | 168 |
| May | 130 | 170 |
| June | 132 | 172 |
| July | 135 | 175 |
| August | 138 | 178 |
| September | 140 | 180 |
| October | 142 | 182 |
| November | 145 | 185 |
| December | 148 | 188 |
Also Read: Infibeam Share Price Target 2024, 2025, 2030, 2040 & 2050: A Fundamental Analysis
Mercury EV-Tech Share Price Target 2030
| Month | Minimum Stock Price | Maximum Stock Price |
|---|---|---|
| January | 350 | 400 |
| February | 352 | 402 |
| March | 355 | 405 |
| April | 358 | 408 |
| May | 360 | 410 |
| June | 362 | 412 |
| July | 365 | 415 |
| August | 368 | 418 |
| September | 370 | 420 |
| October | 372 | 422 |
| November | 375 | 425 |
| December | 478 | 528 |
Also Read: Wipro Share Price Target 2024, 2025, 2030, 2040, 2050: A Comprehensive Analysis
Mercury EV-Tech Share Price Target 2035
| Month | Minimum Stock Price | Maximum Stock Price |
|---|---|---|
| January | 800 | 950 |
| February | 802 | 952 |
| March | 850 | 970 |
| April | 859 | 980 |
| May | 880 | 1010 |
| June | 910 | 1025 |
| July | 924 | 1035 |
| August | 930 | 1040 |
| September | 950 | 1060 |
| October | 960 | 1072 |
| November | 975 | 1085 |
| December | 985 | 1088 |
Also Read: Waaree Share Price Target 2024, 2025, 2030: A Fundamental Analysis
Mercury EV-Tech Share Price Target 2040
| Month | Minimum Stock Price | Maximum Stock Price |
|---|---|---|
| January | 2000 | 2250 |
| February | 2202 | 2252 |
| March | 2205 | 2255 |
| April | 2208 | 2258 |
| May | 2210 | 2260 |
| June | 2212 | 2262 |
| July | 2215 | 2265 |
| August | 2218 | 2268 |
| September | 2220 | 2270 |
| October | 2222 | 2272 |
| November | 2225 | 2275 |
| December | 2228 | 2278 |
Also Read: Orient Green Power Share Price Target 2024, 2025, 2030: A Strategic Analysis
Mercury EV-Tech Share Price Target 2050
| Month | Minimum Stock Price | Maximum Stock Price |
|---|---|---|
| January | 4250 | 4300 |
| February | 4252 | 4302 |
| March | 4255 | 4305 |
| April | 4258 | 4308 |
| May | 4260 | 4310 |
| June | 4262 | 4312 |
| July | 4265 | 4315 |
| August | 4268 | 4318 |
| September | 4270 | 4320 |
| October | 4272 | 4322 |
| November | 4275 | 4325 |
| December | 4278 | 4328 |
Also Read: Unveiling the Future: UCO Bank Share Price Target 2024, 2025, 2030, 2040 & 2050
Mercury EV-Tech Ltd. Analysis Report: Should You Buy or Not?
The Indian auto industry ranks among the world’s top 5, with strong export growth projected. Government support fuels sector development, but sustainability remains a question.
Company Performance:
- Sales: Impressive 1,035.35% growth, reaching Rs 4.09 Cr in the latest quarter.
- Inventory Turnover: Low 2.23 times, indicating potential inventory management issues.
- Profit: Grew by 281.12% to Rs 0.88 Cr, fueled by government permits and rising demand.
- Operating Profit: Rs 0.79 Cr in the latest quarter, reflecting operational efficiency.
- Returns:
- ROE: Low 3.45%, worrisome for an auto company with high equity investments.
- Debt-to-Equity: Favorable 0.45 ratio, indicating low debt reliance.
- Dividend Yield: 0%, suggesting limited profit sharing with shareholders.
- Ownership: High promoter holding of 62.56% with no pledging.
- Valuation:
- P/E Ratio: Extremely high 697.46 compared to historical average of 52.77, suggesting potential overvaluation.
Mercury EV-Tech Ltd. Strengths and Weakness
Strengths
- The company maintains a healthy interest coverage ratio of 54.23, indicating its ability to meet interest obligations comfortably.
- With a current ratio of 16.35, the company boasts a strong liquidity position.
- A high promoter holding of 62.56% signifies confidence in the company’s prospects.
- The company demonstrates robust operating leverage, with an average operating leverage of 52.52.
Weakness
- Over the past 3 years, the company has recorded a poor ROE of 4.85%.
- Negative cash flow from operations of -14.81 raises concerns about the company’s cash management.
- The company’s EBITDA margin has been low at 1.32% over the past 5 years, indicating challenges in generating operating profits.
- Trading at a high P/E ratio of 697.46 and EV/EBITDA of 466.94, the company’s stock appears to be overvalued.
Disclaimer: This is not financial advice, and you should always conduct your own research before investing.