Today, we explore Vedanta Share Price Target for 2024, 2025, 2030 and so on. To know how the stock will perform in the upcoming years, read the complete technical and fundamental analysis report.
What is Vedanta Ltd.?
Vedanta Limited, an Indian-based natural resources company established in 1965, operates across various sectors including oil and gas, zinc, lead, silver, copper, iron ore, steel, nickel, aluminum, power, and glass substrate. Its diverse product portfolio serves industries such as power, transportation, construction, packaging, renewable energy, automobile, and aerospace.
The company produces aluminum ingots, primary foundry alloys, wire rods, billets, rolled products, iron ore, pig iron, copper products including copper rod, cathode, and copper car bar with housing wires, winding wires, and cables.
Its crude oil is sold to both public and private refineries, while natural gas is utilized by the fertilizer industry and city gas distribution sector in India.
Company Profile
| Company Type | Public |
| Traded As | BSE: 500295 NSE: VEDL |
| Industry | Mining, Oil and Gas, Electric Utility |
| Predecessor | Sesa Goa, Sesa Sterlite |
| Founded | 1979 (45 years ago) |
| Headquarters | Mumbai, India |
| Key People | Anil Agarwal (Non-Executive Chairman) Sunil Duggal (CEO) |
| Products | Zinc, Crude Oil, Iron Ore, Steel, Aluminium, Copper, Electric Power |
| Revenue | ₹150,159 crore (US$19 billion) (2023) |
| Operating Income | ₹20,276 crore (US$2.5 billion) (2023) |
| Net Income | ₹14,506 crore (US$1.8 billion) (2023) |
| Total Assets | ₹196,356 crore (US$25 billion) (2023) |
| Total Equity | ₹49,427 crore (US$6.2 billion) (2023) |
| Number of Employees | 1,50,000 (2022) direct and indirect |
| Parent | Vedanta Resources |
| Subsidiaries | Bharat Aluminium Company, Lanjigarh Alumina Refinery, Hindustan Zinc, Sterlite Copper, Sterlite Technologies, Sterlite Energy, Cairn India, Electrosteel Ltd (ESL), Talwandi Sabo Power Limited, Sesa Goa Iron Ore, Gamsberg, Black Mountain Mining, Skorpion Zinc |
| Website | vedantalimited.com |
Vedanta Ltd. Fundamental Analysis
| MARKET CAP | ₹ 1,11,683.25 Cr. |
| ENTERPRISE VALUE | ₹ 1,58,726.25 Cr. |
| NO. OF SHARES | 371.72 Cr. |
| P/E | 5.22 |
| P/B | 1.61 |
| FACE VALUE | ₹ 1 |
| DIV. YIELD | 35.32 % |
| BOOK VALUE (TTM) | ₹ 187.04 |
| CASH | ₹ 5,465 Cr. |
| DEBT | ₹ 52,508 Cr. |
| PROMOTER HOLDING | 63.71 % |
| EPS (TTM) | ₹ 57.53 |
| SALES GROWTH | 7.59% |
| ROE | 37.69 % |
| ROCE | 25.74% |
| PROFIT GROWTH | 58.63 % |
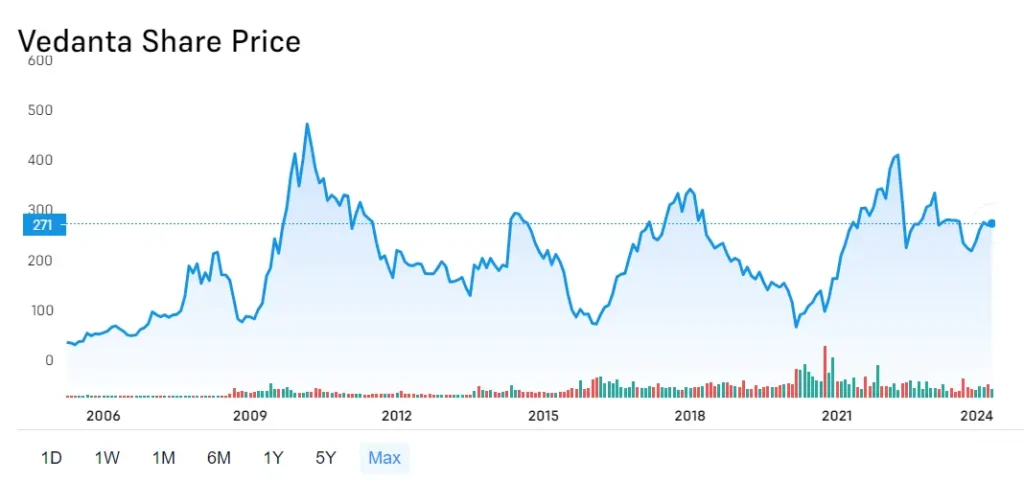
Vedanta Ltd. Share Price Historical Chart

Vedanta Share Price Target 2024, 2025 to 2030
Vedanta Share Price Target 2024
| Year | Vedanta Share Price Target 2024 |
|---|---|
| 2024 | ₹ 307 to ₹ 455 |
According to our analysis, vedanta’s share price potential range of ₹ 307 to ₹ 455.
Other Analysts:
Dr. Krishnan (Dr. Anand Krishnan, a highly respected financial analyst with over 20 years of experience in the Indian stock market.) acknowledges the bullish forecast for Vedanta’s share price in 2024, with a potential range of ₹307.23 to ₹404.58.
Also Read: Century Textiles Share Price Target 2024, 2025, 2030
Vedanta Share Price Target 2025
| Year | Vedanta Share Price Target 2025 |
|---|---|
| 2025 | ₹ 450 to ₹ 601 |
According to our projections, Vedanta’s share price targets stands between ₹450 to ₹601, If the market condition met and vedanta growing continuously.
Other Experts Analysis:
Ms. Chandrasekhar (Ms. Suchita Chandrasekhar, a leading expert in the Indian resources sector with over 15 years of experience.) acknowledges the generally positive forecasts for Vedanta’s share price in 2025, with initial targets ranging from ₹413 to ₹564.
Also Read: RIL Share Price Target 2024, 2025 to 2030
Vedanta Share Price Target 2030
| Year | Vedanta Share Price Target 2030 |
|---|---|
| 2030 | ₹ 2500 to ₹ 3500 |
Also Read: CDSL Share Price Target 2024, 2025 to 2030: A Strategic Analysis
Vedanta Ltd. Balance Sheet Analysis
Current Liabilities:
- Vedanta has high current liabilities (short-term debts) of ₹766.4 billion due within a year.
- Cash and near-term receivables (money owed by customers) totaling ₹399.5 billion are insufficient to cover these liabilities.
- This means Vedanta might need additional financing to meet its short-term obligations.
Debt Ratios:
- The low debt-to-EBITDA ratio (1.3) suggests Vedanta’s debt level is manageable compared to its earnings before interest, taxes, depreciation, and amortization (EBITDA).
- However, the interest coverage ratio (EBIT to interest expense) of 3.9 is low.
Profitability and Cash Flow:
- Vedanta’s EBIT (earnings before interest and taxes) declined by 27% last year, raising concerns about its ability to service debt in the future.
- Free cash flow, which represents actual cash available for debt repayment, is around 70% of EBIT, which is considered normal.
Vedanta Ltd. Share Quick Analysis Report
- Price-to-Earnings (P/E) Ratio: Vedanta’s P/E ratio of 5.22 suggests it may be undervalued compared to its earnings potential.
- Share Price: Vedanta’s current share price is Rs 300.45, which can be assessed using valuation calculators to determine if it’s undervalued or overvalued.
- Return on Assets (ROA): Vedanta’s ROA of 18.17% indicates efficient utilization of assets to generate profits, boding well for future performance.
- Current Ratio: Despite Vedanta’s current ratio of 0.61, which is lower than ideal, it’s important to note how it manages short-term liabilities against assets.
- Return on Equity (ROE): With an ROE of 37.69%, Vedanta demonstrates a strong ability to generate profits from shareholders’ investments.
- Debt-to-Equity (D/E) Ratio: Vedanta’s low D/E ratio of 0.78 signifies a conservative capital structure with minimal reliance on debt.
- Inventory Turnover Ratio: Vedanta’s inventory turnover ratio of 8.11 indicates room for improvement in inventory and working capital management.
- Sales Growth: Although Vedanta’s revenue growth is modest at 7.59%, it’s essential to consider this alongside other performance indicators.
- Operating Margin: Vedanta’s operating margin of 13.87% reflects its operational efficiency and profitability.
- Dividend Yield: Vedanta’s current year dividend of Rs 101.50 yields a substantial return of 33.91% relative to its stock price, making it an attractive option for dividend investors.
👍 Strengths
- Over the past 3 years, the company has demonstrated robust profit growth, registering an impressive 82.35% increase.
- The company has exhibited strong revenue growth, with a notable increase of 23.83% over the same period.
- Maintaining a healthy Return on Equity (ROE) of 24.81% for the past 3 years reflects the company’s efficient utilization of shareholders’ funds.
- With a low PEG ratio of 0.09, the company’s stock is potentially undervalued relative to its earnings growth rate.
- Demonstrating efficient management of cash flows, the company maintains a negative Cash Conversion Cycle of -16.14 days, indicating effective working capital management.
- The company possesses a significant degree of Operating leverage, with an average Operating leverage standing at 27.24, highlighting its ability to enhance profitability with increased sales.
👎 Weakness
- The company’s low tax rate of -1.28% may raise questions regarding its tax practices or tax incentives utilized.
- High promoter pledging at 99.99% raises concerns about the level of control and financial risk associated with the company’s ownership structure.
Vedanta’s Top Shareholders
- Vedanta, Inc. (63.71%)
- Life Insurance Corporation of India (Investment Portfolio) (9.024%)
- Ptc Cables Pvt Ltd. (2.140%)
- Other shareholders holding less than 1% each:
- HDFC Asset Management Co. Ltd. (Invt Mgmt)
- SBI Funds Management Ltd.
- Invesco Asset Management (India) Pvt Ltd.
- UTI Asset Management Co. Ltd. (Investment Management)
- Aditya Birla Sun Life Amc Ltd. (Investment Management)
- Kotak Mahindra Asset Management Co. Ltd.
- Nippon Life India Asset Management Ltd. (Invt Mgmt)
FAQs
Disclaimer: Dear Readers, Please note, These stock price projections are based on various factors like past performance, fundamentals, technical signals and market trends. These projections are for informational purposes only and aren’t financial advice or guarantees.
