Teamlease Services Share Price Target 2024, 2025 to 2030
In this blog post, we will talk about Teamlease Services share price targets for 2024, 2025 to 2030. To know how the stock will perform in the upcoming years, read the complete technical and fundamental analysis report.
Before moving on it’s Analysis, We first understand that what is Teamlease Services Ltd. and what he do?
What is Teamlease Services Ltd.?
TeamLease Services Limited, an India-based company, specializes in providing a range of HR solutions, including staffing services, temporary and permanent recruitment, payroll outsourcing, regulatory compliance, vocational training, technology-driven hiring services, and specialized academic offerings.
The company operates through segments such as General Staffing and Allied Services, Specialized Staffing Services, and Other HR Services. Within these segments, it offers staffing operations, apprenticeship programs, IT and telecom staffing, permanent recruitment, regulatory compliance, and training services.
Established in 2000, TeamLease Services Limited is led by Managing Director Mr. Ashok Reddy, and is listed on the National Stock Exchange under the symbol TEAMLEASE.
Company Profile
| Company Type | Public |
| Traded as | BSE: 539658 NSE: TEAMLEASE |
| ISIN | INE985S01024 |
| Industry | Recruitment and Human Resources Services |
| Founded | 2000 |
| Founders | Manish Sabharwal Ashok Reddy |
| Headquarters | Bengaluru, Karnataka, India |
| Number of Locations | 9 |
| Number of Employees | 282,000 |
| Website | teamlease.com |
Teamlease Services Ltd. Fundamental Analysis
| Market Cap | ₹ 4,712.06 Cr. |
| Enterprise Value | ₹ 4,551.50 Cr. |
| No. of Shares | 1.68 Cr. |
| P/E | 45.34 |
| P/B | 6.37 |
| Face Value | ₹ 10 |
| Dividend Yield | 0 % |
| Book Value (TTM) | ₹ 441.18 |
| Cash | ₹ 173.52 Cr. |
| Debt | ₹ 12.96 Cr. |
| Promoter Holding | 31.61 % |
| EPS (TTM) | ₹ 61.98 |
| Sales Growth | 21.91 % |
| ROE | 13.40 % |
| ROCE | 13.91 % |
| Profit Growth | 332.05 % |
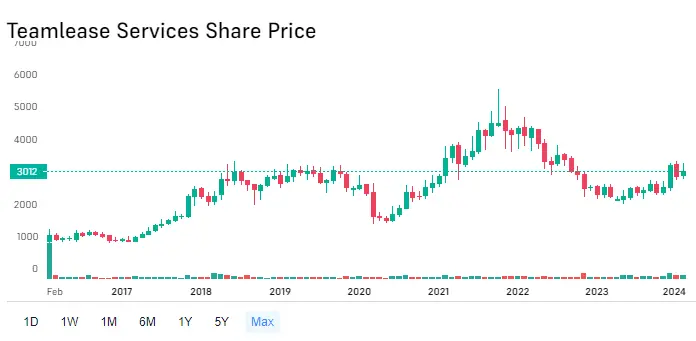
Teamlease Services Ltd. Share Price Growth Chart
Teamlease Services Ltd. Profit & Loss Report
| PARTICULARS | MAR 2021 (₹ Cr.) | MAR 2022 (₹ Cr.) | MAR 2023 (₹ Cr.) |
|---|---|---|---|
| Net Sales | 4,465.94 | 5,640.34 | 6,876.18 |
| Total Expenditure | 4,425.98 | 5,559.46 | 6,802.96 |
| Operating Profit | 39.96 | 80.87 | 73.21 |
| Other Income | 72.28 | 37.16 | 56.52 |
| Interest | 5.78 | 3.58 | 4.76 |
| Depreciation | 15.12 | 18.21 | 23.47 |
| Exceptional Items | 0 | -71.93 | -2.33 |
| Profit Before Tax | 91.35 | 24.31 | 99.18 |
| Tax | 7.28 | 1.82 | 1.98 |
| Net Profit | 84.07 | 22.50 | 97.20 |
| Adjusted EPS (₹) | 49.17 | 13.16 | 56.85 |
- Revenue (Net Sales): The company’s revenue has grown steadily over the past five years, from ₹4,132.47 crore in March 2019 to ₹6,876.18 crore in March 2023. This represents a compound annual growth rate (CAGR) of around 8.5%.
- Profitability: The company’s profitability has fluctuated over the past five years. Operating profit reached a high of ₹80.87 crore in March 2022 but then declined to ₹73.21 crore in March 2023. Net profit also showed fluctuations, reaching a high of ₹97.02 crore in March 2019 and ₹97.20 crore in March 2023.
- Taxes: The company’s tax expense has been relatively low throughout the period, ranging from ₹0.35 crore in March 2019 to ₹53.43 crore in March 2020. The effective tax rate in March 2023 was only 2%, which is significantly lower than the corporate tax rate in India.
- Other Income and Expenses: Other income, which includes income from sources other than core business activities, has increased significantly over the past five years. This could be due to factors such as investments or interest income. Depreciation expense has also increased steadily, reflecting the company’s investments in property, plant, and equipment.
Teamlease Services Ltd. Balance Sheet Report
| Equity and Liabilities | MAR 2021 (₹ Cr.) | MAR 2022 (₹ Cr.) | MAR 2023 (₹ Cr.) |
|---|---|---|---|
| Share Capital | 17.10 | 17.10 | 17.10 |
| Total Reserves | 637.29 | 661.42 | 760.38 |
| Borrowings | 0 | 0 | 0 |
| Other N/C liabilities | 96.18 | 123.61 | 164.10 |
| Current liabilities | 500.92 | 567.13 | 644.67 |
| Total Liabilities | 1,251.54 | 1,369.26 | 1,586.25 |
Equity and Liabilities:
- Equity: The company’s share capital has remained constant at ₹17.10 crore over the past 3 years. However, total reserves have increased significantly, from ₹511.83 crore in March 2019 to ₹760.38 crore in March 2023.
- Debt: The company is virtually debt-free, with no borrowings reported in the past 3 years.
- Current Liabilities: Current liabilities, such as accounts payable and accrued expenses, have increased steadily over the past 3 years.
| Assets | MAR 2021 (₹ Cr.) | MAR 2022 (₹ Cr.) | MAR 2023 (₹ Cr.) |
|---|---|---|---|
| Net Block | 27.90 | 37.78 | 88.59 |
| Capital WIP | 0 | 0 | 0 |
| Intangible WIP | 14.41 | 16.28 | 14.80 |
| Investments | 313.88 | 324.05 | 337.25 |
| Loans & Advances | 93.22 | 138.18 | 213.24 |
| Other N/C Assets | 102.95 | 116.28 | 103.03 |
| Current Assets | 699.19 | 736.68 | 829.35 |
| Total Assets | 1,251.54 | 1,369.26 | 1,586.25 |
Assets:
- Fixed Assets: Net block, which represents the company’s property, plant, and equipment after depreciation, has increased steadily over the past 3 years.
- Intangible Assets: The value of intangible assets, such as patents or trademarks, has also increased slightly.
- Investments: Investments have grown steadily, reaching ₹337.25 crore in March 2023.
- Current Assets: Current assets, which include cash, inventory, and accounts receivable, have also increased over the past 3 years.
Teamlease Services Share Price Target 2024, 2025 to 2030
| Year | Minimum Target | Maximum Target |
|---|---|---|
| 2024 | ₹2900.74 | ₹3500.38 |
| 2025 | ₹3500.41 | ₹3860.09 |
| 2026 | ₹3850.92 | ₹4050.15 |
| 2027 | ₹4055.18 | ₹4380.21 |
| 2028 | ₹4379.36 | ₹4610.44 |
| 2029 | ₹4611.25 | ₹4970.19 |
| 2030 | ₹4975.40 | ₹5,500.55 |
Teamlease Services Share Price Target 2024
| Year | Teamlease Share Price Target 2024 |
|---|---|
| 2024 | ₹2900.74-₹3500.38 |
Analysts predict a strong start for TeamLease in 2024, with the share price potentially reaching ₹2900.74 in January. As the year progresses, there’s a chance for further growth, with the target reaching a high of ₹3500.38 by December in a favorable market scenario.
Also Read: Boeing Share Price Prediction 2024, 2025 to 2030
Teamlease Services Share Price Target 2025
| Year | Teamlease Share Price Target 2025 |
|---|---|
| 2025 | ₹3500.41-₹3860.09 |
The positive outlook seems to continue in 2025. The target price is expected to take off at ₹3500.41 in January and maintain a steady trajectory throughout the year. By December, analysts predict a closing target of ₹3860.09.
Also Read: Suryoday Small Finance Bank Share Price Target 2024, 2025 to 2030
Teamlease Services Share Price Target 2026, 2027, 2028, 2029
2026 might see a period of consolidation for TeamLease’s share price. While the starting target is ambitious at ₹3850.92 in January, there’s a possibility of some price adjustments throughout the year. The year-end target sits at ₹4050.15, indicating a potential for moderate growth or stabilization.
- 2027: The target range is between ₹4055.18 and ₹4380.21, with a potential for a slight price decrease later in the year.
- 2028: The target starts at ₹4379.36 and is expected to reach ₹4610.44 by December.
- 2029: The projected range is ₹4611.25 to ₹4970.19, indicating a potential rise throughout the year.
Teamlease Services Share Price Target 2030
| Year | Teamlease Share Price Target 2030 |
|---|---|
| 2030 | ₹4975.40-₹5,500.55 |
The target kicks off at ₹4,975.4 and is expected to reach a high of ₹5,500.55 by year-end.
Also Read: Adani Power Share Price Target 2024, 2025, 2030, 2040, 2050
Teamlease Services Ltd. Share Quick Analysis: Buy Or Sell?
TeamLease Services Ltd., at a glance, seems to have mixed indicators for potential investors to consider.
- Valuation:
- P/E Ratio (46.24): High, indicating the stock might be overvalued compared to its earnings.
- Current Share Price (₹2,865.70): Valuation tools can help determine if it’s fairly priced.
- Profitability:
- Return on Assets (ROA 6.58%): Low, suggesting the company isn’t generating a strong return on its assets.
- Return on Equity (ROE 13.40%): Decent, indicating the company is generating some profit from shareholder investments.
- Financial Health:
- Debt to Equity Ratio (0.02): Very low debt, a positive sign for financial stability.
- Current Ratio (1.29): Below the ideal range of 2:1, indicating the company might have difficulty meeting short-term obligations with current assets.
- Efficiency:
- Inventory Turnover Ratio (0): Very low, suggesting the company might be holding onto inventory too long, impacting working capital.
- Operating Margin (1.06%): Very low, indicating a small profit margin after accounting for operating expenses.
- Growth:
- Sales Growth (21.91%): Fair, indicating some revenue growth.
- Dividend: No dividend offered currently.
👍 Strengths
- The company has demonstrated robust profit growth of 32.71% over the past 3 years.
- Significant reduction in debt by ₹12.21 Cr, rendering the company virtually debt-free.
- Maintains a healthy Interest Coverage Ratio of 21.84.
- Remarkably low PEG ratio of 0.14, indicating potential undervaluation.
- Efficient Cash Conversion Cycle of 13.08 days.
- Strong degree of Operating Leverage with an average of 3.56.
👎 Weakness
- Poor revenue growth of 12.86% over the past 3 years.
- Low tax rate at 2.00%.
- Subpar EBITDA margin of 1.33% over the past 5 years.
- High EV/EBITDA ratio of 30.69, indicating a potentially overvalued stock.
FAQs
Disclaimer: Dear Readers, Please note, These stock price projections are based on factors like past performance and market trends. These projections are for informational purposes only and aren’t financial advice or guarantees.