Devyani International Share Price Target 2024, 2025, 2030: A Strategic Analysis
Welcome to our latest blog article, where we delve into the strategic analysis of Devyani International share price targets for the years 2024, 2025, and even beyond to 2030.
Devyani International is a prominent player in the Indian food and beverage industry, with a portfolio that includes popular brands like KFC, Pizza Hut, and Costa Coffee. In this article, we’ll examine various factors influencing Devyani International’s share price, including market trends, financial performance, competitive landscape, and strategic initiatives.
Whether you’re an investor looking to make informed decisions or simply interested in the dynamics of the food service sector, this analysis aims to provide valuable insights into Devyani International’s future trajectory.
About Devyani International Ltd.
Devyani International Limited, an Indian-based company, specializes in developing, managing, and operating quick-service restaurants and food courts for renowned brands such as Pizza Hut, KFC, Costa Coffee, and Vaango.
Operating primarily within India and also expanding internationally, the company runs over 490 KFC stores and approximately 506 Pizza Hut outlets across the country.
Additionally, Devyani International serves as a franchisee for Costa Coffee in India, managing around 112 Costa Coffee stores. With subsidiaries like Devyani Food Street Private Limited and a presence in Nepal and Nigeria, Devyani International has established itself as a key player in the food and beverage industry.
Devyani International Ltd. Fundamental Analysis
| Company Fundamentals | Amount |
|---|---|
| Market Cap | ₹ 19,366.09 Cr. |
| Enterprise Value | ₹ 19,294.78 Cr. |
| No. of Shares | 120.59 Cr. |
| P/E | 131.95 |
| P/B | 16.26 |
| Face Value | ₹ 1 |
| Dividend Yield | 0 % |
| Book Value (TTM) | ₹ 9.88 |
| Cash | ₹ 71.32 Cr. |
| Debt | ₹ 0 Cr. |
| Promoter Holding | 62.74 % |
| EPS (TTM) | ₹ 1.22 |
| Sales Growth | 43.98% |
| ROE | 24.31 % |
| ROCE | 32.15% |
| Profit Growth | 60.43 % |
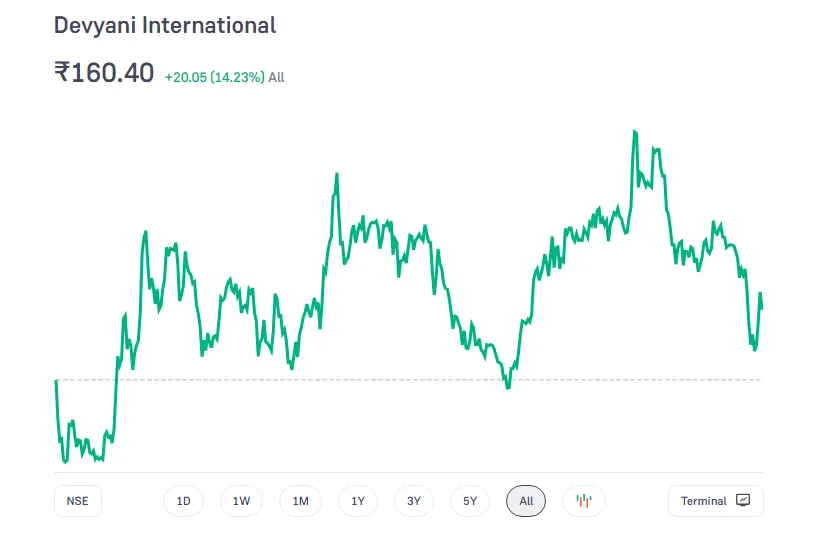
Devyani International Ltd. Share Price Growth Chart
Devyani International Ltd. Profit & Loss – Last 3 Years
| DATA | MAR 2021 (CR.) | MAR 2022 (CR.) | MAR 2023 (CR.) |
|---|---|---|---|
| Net Sales | 998.76 | 1,853.27 | 2,668.34 |
| Total Expenditure | 844.16 | 1,468.97 | 2,126.09 |
| Operating Profit | 154.60 | 384.31 | 542.26 |
| Other Income | 48.86 | 21.44 | 35.20 |
| Interest | 127.77 | 106.85 | 124.56 |
| Depreciation | 191.47 | 185.28 | 238.87 |
| Exceptional Items | 45.75 | -1.32 | 0 |
| Profit Before Tax | -70.03 | 112.31 | 214.03 |
| Tax | 0 | -41.08 | -32.04 |
| Net Profit | -65.31 | 153.38 | 246.07 |
| Adjusted EPS (Rs.) | -0.61 | 1.27 | 2.04 |
Also Read: Mercury EV-Tech Share Price Target 2024, 2025, 2030, 2040, 2050: A Detailed Analysis
Devyani International Share Price Target 2024, 2025, 2030
Also Read: Mahindra and Mahindra Share Price Target 2024, 2025, 2030: A Detailed Analysis
Devyani International Share Price Target 2024
| Year | Devyani International Share Price Prediction |
| 2024 | ₹165.42 and ₹183.73 |
Analysts have attempted to forecast Devyani International’s share price for 2024 using technical analysis, a method based on historical price trends and trading patterns. This analysis suggests a possible range between ₹165.42 and ₹183.73.
Also Read: Hindalco Share Price Target 2024, 2025, 2030: A Strategic Analysis
Devyani International Share Price Target 2025
| Year | Devyani International Share Price Prediction |
| 2025 | ₹196.11 to ₹219.82 |
Expert offer further projections, outlining potential targets for 2025 and even 2030. These estimates, however, tend to be less reliable and should be interpreted with caution. The predicted range for 2025 is ₹196.11 to ₹219.82.
Also Read: Wipro Share Price Target 2024, 2025, 2030, 2040, 2050: A Comprehensive Analysis
Devyani International Share Price Target 2030
| Year | Devyani International Share Price Prediction |
| 2025 | ₹252.15 to ₹250.54 |
Predictions for 2030, like the range of ₹252.15 to ₹250.54, should be viewed with extreme caution due to their highly speculative nature. The timeframe is so vast that unforeseen factors like technological advancements, economic upheavals, or even changes in consumer preferences could drastically impact the actual share price, rendering these predictions highly unreliable.
Also Read: Tech Mahindra Share Price Target 2024, 2025 and 2030: A Detailed Overview
Devyani International Ltd. Share Analysis Report
Stock investing necessitates thorough analysis of financial data to ascertain a company’s true value. This typically involves scrutinizing the company’s profit and loss account, balance sheet, and cash flow statement, which can be both time-consuming and arduous. A more streamlined approach to gauging a company’s performance involves examining its financial ratios, which offer valuable insights into various aspects of its financial health.
- PE ratio: The Price to Earnings ratio indicates how much an investor is willing to pay for a share relative to its earnings. A low P/E ratio is generally considered indicative of undervaluation, although this depends on other factors. Devyani International’s PE ratio of 132.24 suggests overvaluation.
- Share Price: Devyani International’s current share price is Rs 160.95. Utilizing valuation calculators can help determine if the share price is undervalued or overvalued.
- Return on Assets (ROA): ROA measures a company’s efficiency in generating profits from its investment in assets. Devyani International’s ROA of 10.02% indicates suboptimal performance.
- Current Ratio: This ratio assesses a company’s ability to meet its short-term liabilities with its short-term assets. Devyani International’s current ratio of 0.61 suggests potential instability in handling unexpected challenges.
- Return on Equity (ROE): ROE gauges a firm’s ability to generate profits from shareholders’ investments. Devyani International’s ROE of 24.31% indicates a favorable return.
- Debt to Equity Ratio: This metric reveals the proportion of debt in a company’s capital structure. Devyani International’s D/E ratio of 0 signifies a low level of debt.
- Inventory Turnover Ratio: This ratio evaluates the efficiency of inventory management. Devyani International’s Inventory turnover ratio of 28.48 reflects efficient management of inventory and working capital.
- Sales Growth: Devyani International has reported revenue growth of 43.98%, indicating satisfactory growth and performance.
- Operating Margin: This metric reflects the operational efficiency of the company. Devyani International’s operating margin for the current financial year stands at 20.32%.
- Dividend Yield: This ratio illustrates the dividend payout in relation to the stock price. Devyani International’s current year dividend is Rs 0, resulting in a yield of 0%.
👍 Strengths
- Over the past 3 years, the company has demonstrated strong profit growth of 76.48%.
- Revenue growth for the same period has been impressive at 29.53%.
- The company has significantly reduced its debt by 60.93 Cr.
- Consistently maintaining a healthy ROCE of 23.11% over the past 3 years.
- Virtually debt-free status.
- Efficient Cash Conversion Cycle of -63.94 days.
- Effective cash flow management indicated by a CFO/PAT ratio of 6.39.
- High promoter holding of 62.74%.
👎Weakness
- ROE over the past 3 years has been low at 1.33%.
- The tax rate is notably low at -14.97.
- Trading at a high PE ratio of 131.95.
- Elevated EV/EBITDA ratio stands at 33.10.